Bioimaging of glutathione variation for early diagnosis of hepatocellular carcinoma using a liver-targeting ratiometric near-infrared fluorescent probe†
Received 20th April 2023 , Accepted 21st May 2023
First published on 23rd May 2023
https://pubs.rsc.org/en/content/articlehtml/2023/TB/D3TB00893B
J. Mater. Chem. B, 2023, 11, 6612-6620.
Abstract
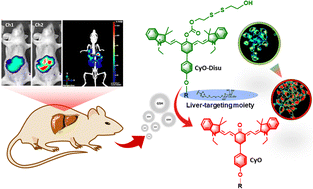
Reliable biomarkers are crucial for early diagnosis of diseases and precise therapy. Biological thiols (represented by glutathione, GSH) play vital roles in the antioxidant defense system for maintaining intracellular redox homeostasis in organisms. However, the aberrant variation in the cellular concentration of GSH correlates with diverse diseases including cancer. Here, a ratiometric near-infrared fluorescent probe CyO-Disu is constructed for the specific sensing of GSH variation in live cells and mice models of hepatic carcinoma (HCC). CyO-Disu features three key elements, a response moiety of bis(2-hydroxyethyl) disulfide, a near-infrared fluorescence signal transducer of heptamethine ketone cyanine, and a targeting moiety of D-galactose. By virtue of its liver-targeting capability, CyO-Disu was utilized for evaluating GSH fluctuations in primary and metastatic hepatoma living cells. To evaluate the efficacy of CyO-Disuin vivo, orthotopic HCC and pulmonary metastatic hepatoma mice models were employed for GSH imaging using two-dimensional and three-dimensional fluorescence molecular tomographic imaging systems. The bioimaging results offered direct evidence that GSH displayed varied concentrations during the progression of HCC. Therefore, the as-synthesized probe CyO-Disu could serve as a potential powerful tool for the early diagnosis and precise treatment of HCC using GSH as a reliable biomarker.
Introduction
The cellular redox state is of critical importance in various physiological and pathological events, including controlling of cell cycle, regulation of programmed cell death, as well as activation of cytokine and growth factor gene expression.1 The disturbance of redox homeostasis results in a variety of pathological processes ranging from neurodegenerative disease, diabetes mellitus, ageing and cancer.2,3 In organisms, antioxidant defense systems composed of antioxidant enzymes and small molecular antioxidants account for removing the excessive reactive oxygen species (ROS) and maintaining the intracellular redox hemostasis.4 As the most abundant low-molecular-weight nonprotein biothiols, glutathione (GSH) exerts its function by adjusting the reduced and oxidized forms through a mercapto-disulfide exchanging mechanism.5 GSH has intracellular concentration of 1 to 10 mM. However, the aberrant concentration ratio between mercapto-disulfide redox status is tightly related to the progression of varieties of diseases such as cancer. Among the various cancer types, hepatocellular carcinoma (HCC) is the malignant tumor whose mortality of cancer ranks the second highest globally.6 The proliferation, motility, apoptosis, and senescence of HCC cells is closely related to the intracellular redox metabolism changes. Hence, it is imperative to detect the GSH level changes for understanding the redox state in the development of HCC by utilizing a selective and sensitive chemical tool.
To date, analytical techniques detecting GSH include enzymatic recycling method, high-performance liquid chromatography, and capillary electrophoresis etc.7,8 Nevertheless, these approaches suffer from complex sample pre-treatment and difficulty in visualization, which is unsuitable for real-time and in situ GSH measurement in live cells and in vivo. Due to the advantages of excellent spectral characteristics, high spatiotemporal resolution, high sensitivity and selectivity, various small molecular fluorescent probes have been constructed for different biomolecules,9-15 including GSH,16-19 based on the strong nucleophilicity and reducibility properties of mercapto unit.20,21 However, an efficient imaging tool being capable of dynamically and in situ evaluating GSH fluctuation in early and advanced stages of mice HCC models has not been reported yet.
Herein, we proposed a new near-infrared (NIR) fluorescent probe CyO-Disu to evaluate GSH by ratiometric signal in live cell lines and mice models (Scheme 1). CyO-Disu consisted of three components: a ketone cyanine fluorophore (Keto-Cy) as NIR fluorescent signal transducer, bis(2-hydroxyethyl) disulfide to be the response unit for GSH, and D-galactose as the moiety to target liver. The spectral properties of CyO-Disu indicated that this probe could rapidly response to GSH in around 5 min, which was a benefit for the real-time imaging in live cells and mice. Various liver cells and liver cancer cells were independently imaged with CyO-Disu to evaluate the probe’s capability in measuring GSH changes in cells. Furthermore, the fluctuation of endogenous GSH level during the process from orthotopic hepatoma to pulmonary metastatic hepatoma were successfully tested with CyO-Disu using two-dimensional (2D) and three-dimensional (3D) fluorescence molecular tomographic (FMT) imaging technique. Up to our knowledge, CyO-Disu is the first fluorescent probe which evaluates the concentration variation of GSH in different stages of mice HCC models.
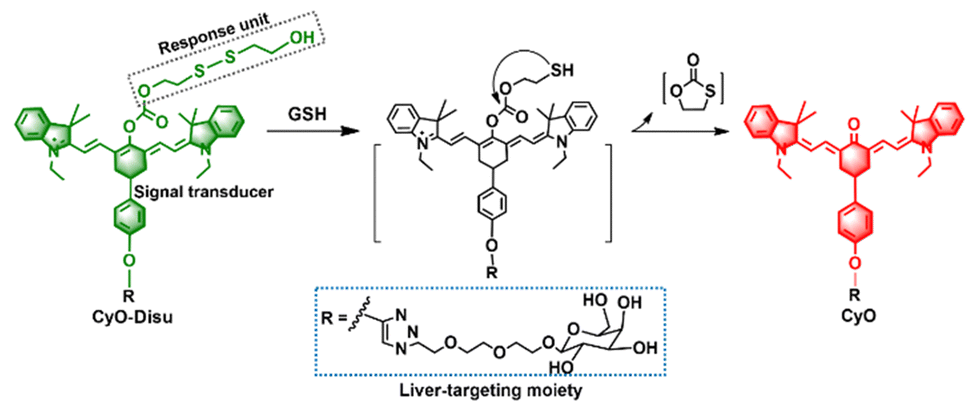
Scheme 1 The molecular structure of CyO-Disu and the proposed reaction mechanism against GSH.
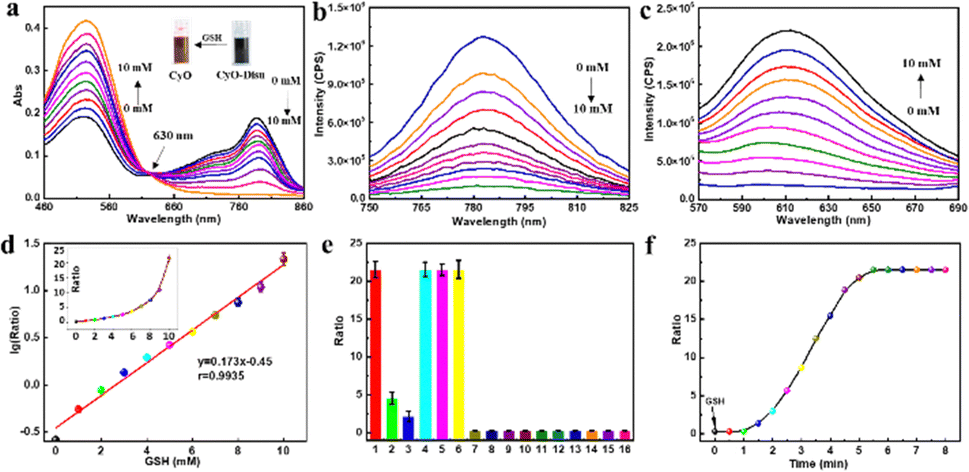
Fig. 1 Spectral characteristics and selectivity of CyO-Disu. (a) Absorption spectra, (b) emission spectra (excitation at 710 nm) and (c) emission spectra (excitation at 535 nm) spectra of CyO-Disu to GSH. CyO-Disu (10 μM) was incubated with GSH (0–10 mM) at 37 °C in HEPES (10 mM, pH 7.4). The spectra were measured after 6 min. (d) Linear correlation between lg(F613nm/F783nm) and GSH concentration (0 – 10 mM). Inset: change of the intensity ratio (F613nm/F783nm) of CyO-Disu (10 μM) as a function of GSH (0–10 mM). (e) Fluorescence ratio (F613nm/F783nm) response of CyO-Disu (10 μM) to various thiols and other non-thiol amino acids at 37 °C in HEPES (10 mM, pH 7.4). 1, 10 mM GSH; 2, 200 μM Cys; 3, 10 μM Hcy; 4, 10 mM dithiothreitol (DTT); 5, 10 mM 2-mercaptoethanol (2-ME); 6, 2-aminoethanethiol (2-AET); 7, 10 μM Trx; 8, 10 mM Glu; 9, 10 mM Pro; 10, 10 mM Ala; 11, 10 mM Phe; 12, 10 mM Ser; 13, 10 mM Val; 14, 10 mM Arg; 15, 10 mM His; and 16, blank. The spectra were recorded after 5 min. (f) Time-dependent fluorescence ratio F613nm/F783nm of CyO-Disu (10 μM) to GSH (10 mM) in a time range of 0–8 min. GSH was introduced into the reaction at initiation in HEPES (10 mM, pH 7.4). Measurement was performed for 8 min. F613nm: λex = 535 nm, λem = 613 nm; F783nm: λex = 710 nm, λem = 783 nm. All the measurements have been repeated three times, and the mean (± s.d.) data are displayed.
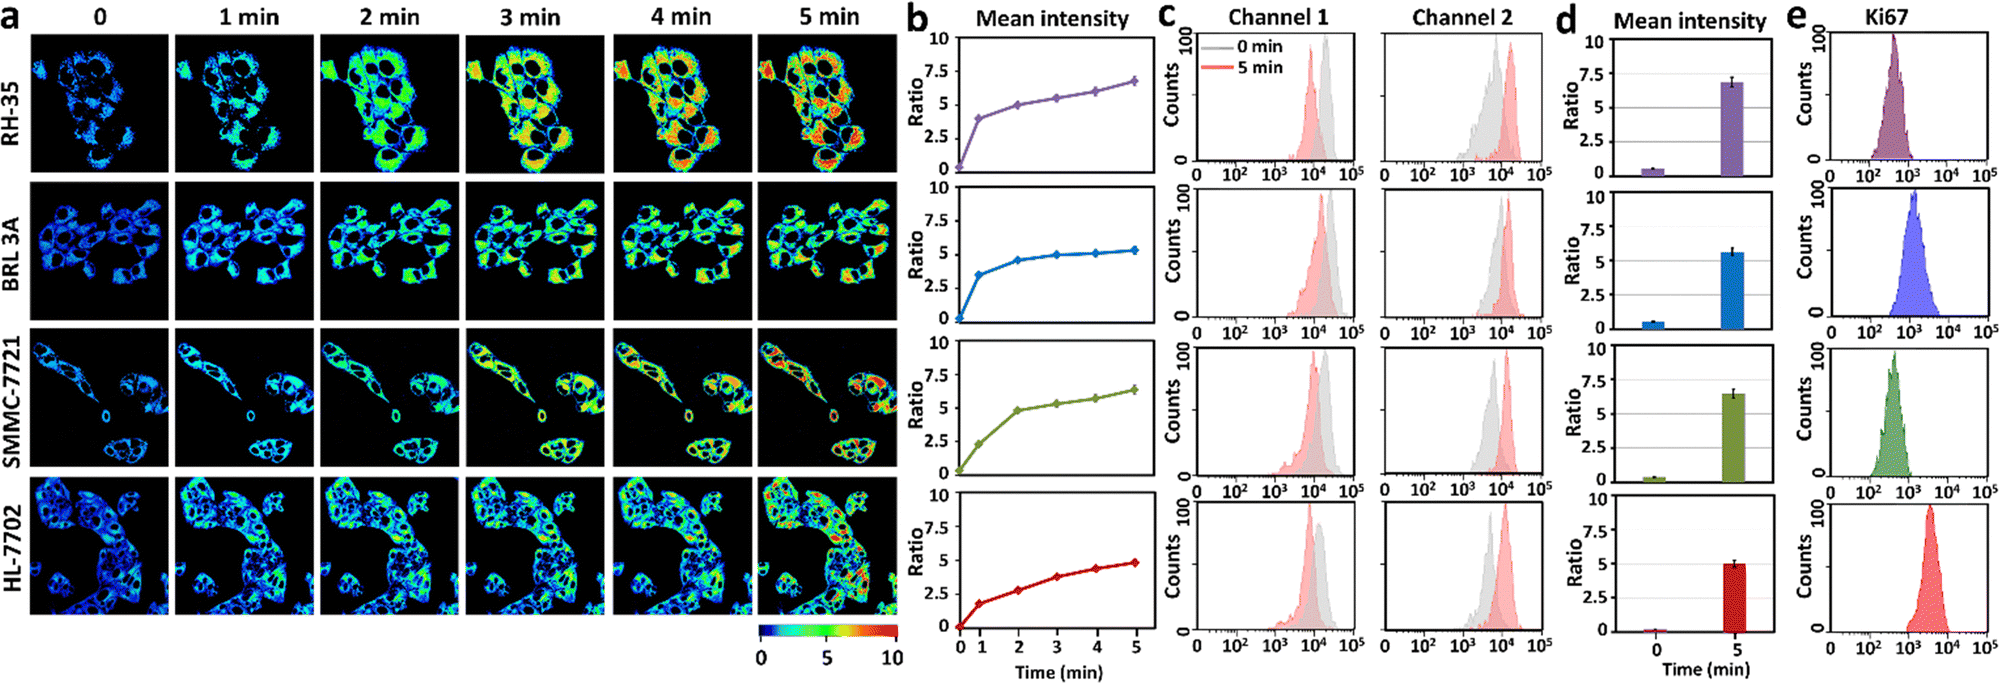
Fig. 2 Fluorescence imaging of the generation of endogenous GSH by probe CyO-Disu in living RH-35, BRL 3A, SMMC-7721, and HL-7702 cells. (a) Pseudocolored ratiometric images of endogenous GSH generation at different times: 0, 1, 2, 3, 4, and 5 min. (b) Average ratio intensities of CyO-Disu against time. (c) Flow cytometry results and (d) the corresponding mean ratio intensity at 0 and 5 min. (e) Histograms of Ki67 expression immunofluorescence response. The experiments were repeated three times, with the data shown as mean (± s.d.). The differences between 0 min and any other groups were analyzed via one-way ANOVA and Bonferroni post hoc test. The variance between the detected groups was analyzed via Student's t-test. * P < 0.05, ** P < 0.01 and *** P < 0.001 was statistically significant.
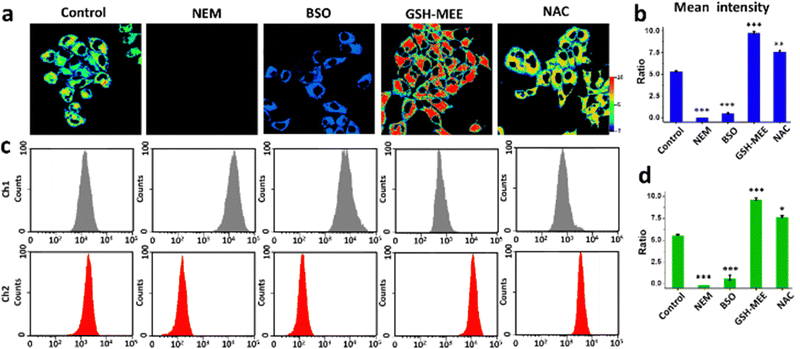
Fig. 3 (a) Pseudocolored ratiometric images of intracellular endogenous thiol concentration fluctuations in living RH-35 cells. (b) Average ratio intensities of images in (a) (number of cells, n = 7). (c) Flow cytometry analysis and (d) relevant mean ratio intensities. The measurement was repeated three times, with the data displayed as mean (±s.d.). The differences between the control group and any other groups were analyzed via one-way ANOVA followed by Bonferroni post hoc test. The differences between the two groups were analyzed via Student's t-test. * P < 0.05, ** P < 0.01 and *** P < 0.001 was statistically significant.
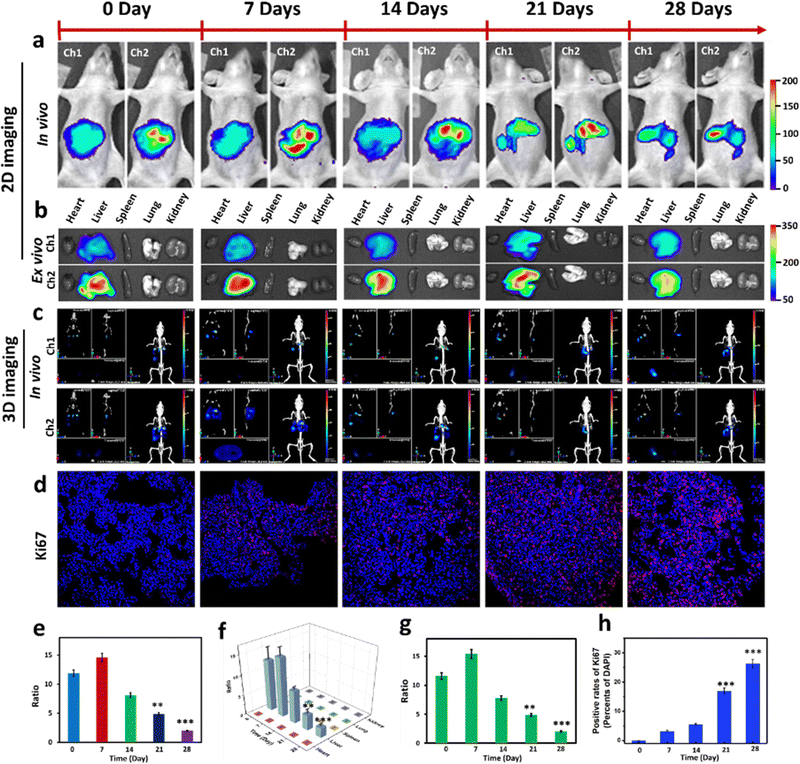
| Fig. 4 Visualization of GSH in the orthotopic mouse HCC model. (a) 2D bioimaging of GSH in mice after tail vein injection of CyO-Disu (10 μM, 200 μL, in in DMSO-saline, 1/99, v/v) for 15 min (n = 3 each group). (b) 2D ex vivo imaging of GSH in isolated organs (heart, liver, spleen, lungs, and kidneys) sacrificed from (a). (c) 3D reconstruction of FMT imaging of GSH from coronal, sagittal, and transverse views. CyO-Disu (10 μM, 200 μL in DMSO-saline, 1/99, v/v) was administered via tail vein for 15 min before bioimaging (n = 3 per group). (d) Expression of proliferation protein marker Ki67 with anti-Ki67 mAb (Alexa Fluor 647 conjugate, λex/λem =635 nm, 670–770 nm, red channel) and nucleus (DAPI, λex/λem = 405 nm, 410–490 nm, blue channel) in tumor sections. Scale bar: 50 μm. (e) Average ratio of the intensity in (a). (f) Mean ratio intensity values of the organs in (b). (g) Ratio value of fluorescence intensity in (c). (h) The statistical analysis of the data from (d). The measurement was repeated three times, with the data displayed as mean (± s.d.). The differences between the control group (0 day) and any other groups were analyzed via one-way ANOVA followed by Bonferroni post hoc test. The variation between different groups was analyzed via Student's t-test. * P < 0.05, ** P < 0.01 and *** P < 0.001 was statistically significant. |
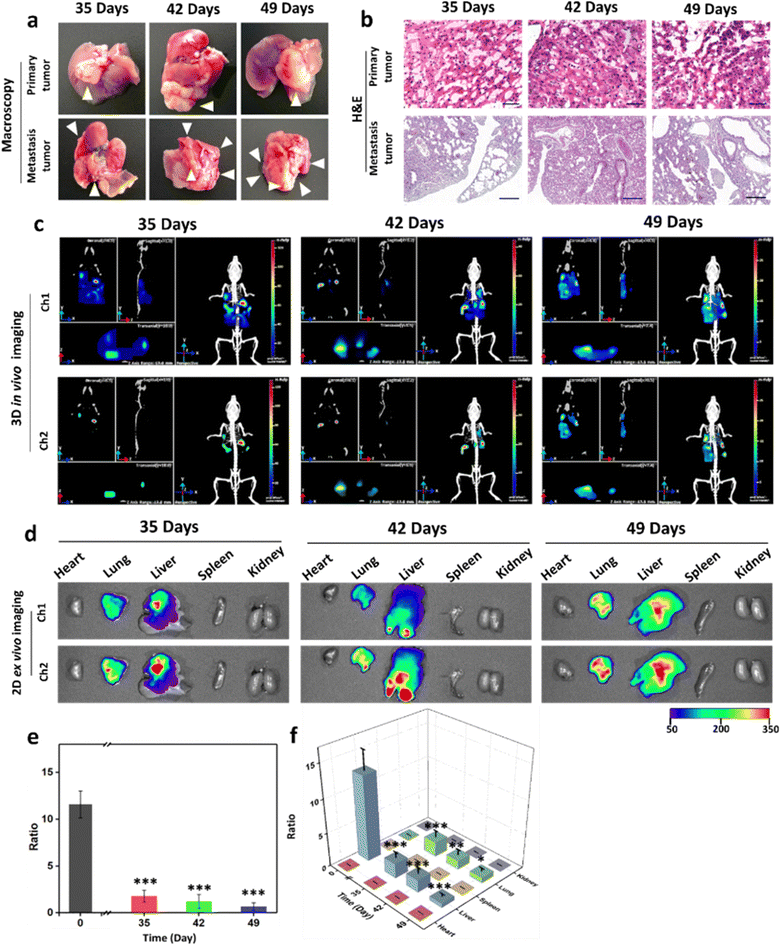
| Fig. 5 Evaluation of GSH in pulmonary metastatic HCC mice models. (a) Macroscopic appearance of the primary tumor and metastasis tumor tissues. (b) H&E staining of the primary tumor (scale bar: 50 μm) and metastasis tumor tissues (scale bar: 200 μm). (c) 3D reconstruction of in vivo imaging of GSH from coronal, sagittal, and transverse views, as well as the 3D image after tail vein injection of CyO-Disu (10 μM, 200 μL, in DMSO-saline, 1/99, v/v) for 15 min. (d) 2D bioimaging of GSH in isolated organs (heart, liver, spleen, lungs, and kidneys) from the mice in (c). (e) Average ratio of the intensity values in (c). (f) Mean ratio intensity values of relevant organs in (d). The measurement was repeated three times, with the data displayed as mean (± s.d.). The differences between the 0-day (control) group and any other groups were analyzed via one-way ANOVA followed by Bonferroni post hoc test. The variation between the different groups was analyzed via Student's t-test. * P < 0.05, ** P < 0.01 and *** P < 0.001 was statistically significant. |
|
4. Conclusions
Early diagnosis and subsequent treatment require reliable disease biomarkers. In this work, we have successfully designed and synthesized a ratiometric NIR fluorescent probe CyO-Disu for the bioimaging of GSH concentration fluctuations in different stages of HCC. CyO-Disu features three key moieties: a fluorophore of NIR heptamethine ketone cyanine, a fluorescence modulator bis(2-hydroxyethyl) disulfide, and a liver-targeting unit D-galactose. Leveraging the intracellular biochemical thiol–disulfide exchange reaction, CyO-Disu can respond to GSH selectively and sensitively in several minutes without inference from other biomolecules. The probe CyO-Disu has been demonstrated to be profitable in detecting the GSH generation in live RH-35, BRL 3A, SMMC-7721, and HL-7702 cells, as well as the endogenous GSH concentration changes in living RH-35. With D-galactose as hepatocytes targeting unit, the probe CyO-Disu can image and evaluate GSH level fluctuations in the orthotopic HCC and pulmonary metastatic hepatoma mice models. The experimental results reveal that the GSH level varies at different stages of HCC, which indicated the potential of employing GSH as a biomarker for the evaluation of HCC development and further therapy. Finally, we envision that the developed probe CyO-Disu can be utilized to aid the diagnosis of HCC at an early stage and gain improved treatment.

