Chemical Engineering Journal , 2023, 1415025,Text Full
Chonggui Qiu【邱崇贵】a, b, 1, Wei Zhang【张伟】 a, b, 1, Yanhong Zhou【周艳虹】 a, b, 1, Hongwang Cui a, Yanlong Xing【邢艳珑】 a, b, Fabiao Yu【于法标】 a, b, * and Rui Wang【王锐】 a, b, *
a Key Laboratory of Hainan Trauma and Disaster Rescue, The First Affiliated Hospital of Hainan Medical University, Hainan Medical University, Haikou 571199, China.
b Engineering Research Center for Hainan Bio-Smart Materials and Bio-Medical Devices, Key Laboratory of Emergency and Trauma, Ministry of Education, Key Laboratory of Hainan Functional Materials and Molecular Imaging, College of Pharmacy, College of Emergency and Trauma, Hainan Medical University, Haikou 571199, China.
1 These authors contributed equally to this work.
Corresponding author E-mail: yufabiao@hainmc.edu.cn, wangrui@hainmc.edu.cn
https://doi.org/10.1016/j.cej.2023.141502
Abstract:
The invasion and metastasis of breast cancer are closely related to various biomarkers expressed on the surface of tumor cells and the tumor microenvironment. The deficiency of sensitive phenotypic diagnosis and therapeutic evaluation toward breast cancers represents a significant challenge in cancer diagnosis and therapy. Herein, we report a crucial example of surface-enhanced Raman scattering (SERS)-based imaging utilizing highly sensitive SERS probes to serve as a robust platform for the detection of breast cancer phenotypic biomarkers expressed on the cell surfaces and therapeutic evaluation after chemical therapy and surgery. The SERS probes feature gold-silver (Au@Ag) core-shell nanoparticles with double-layer Raman reporters embedding on the surfaces of the gold core and silver shell, respectively, which further conjugate with specific antibodies. The highly enhanced SERS signals permit the sensitive detection of specific phenotypic biomarkers expressed on the cell surface. In the present work, the epidermal growth factor receptors (EGFR and ErbB2) and insulin-like growth factor 1 (IGF1) were selected as the target biomarkers and assessed the expression in MCF-10A human normal breast cell line and MDA-MB-468, SK-BR-3, KPL-4 human breast cancer cell lines through the SERS-based imaging technique. In the xenotransplanted breast tumor model, systematic delivery of SERS probes enabled precise therapeutic evaluation after anticancer drug tamoxifen therapy and surgery treatment through SERS imaging. Consequently, SERS imaging was consistent with H&E and Masson staining. These results suggest the proposed SERS-based imaging technique has a strong potential to be a powerful tool for precise diagnosis and therapeutic efficacy of breast cancers.
Keywords: surface-enhanced Raman scattering (SERS) imaging; phenotypic biomarker detection; breast cancer; chemotherapy and surgery; therapeutic evaluation
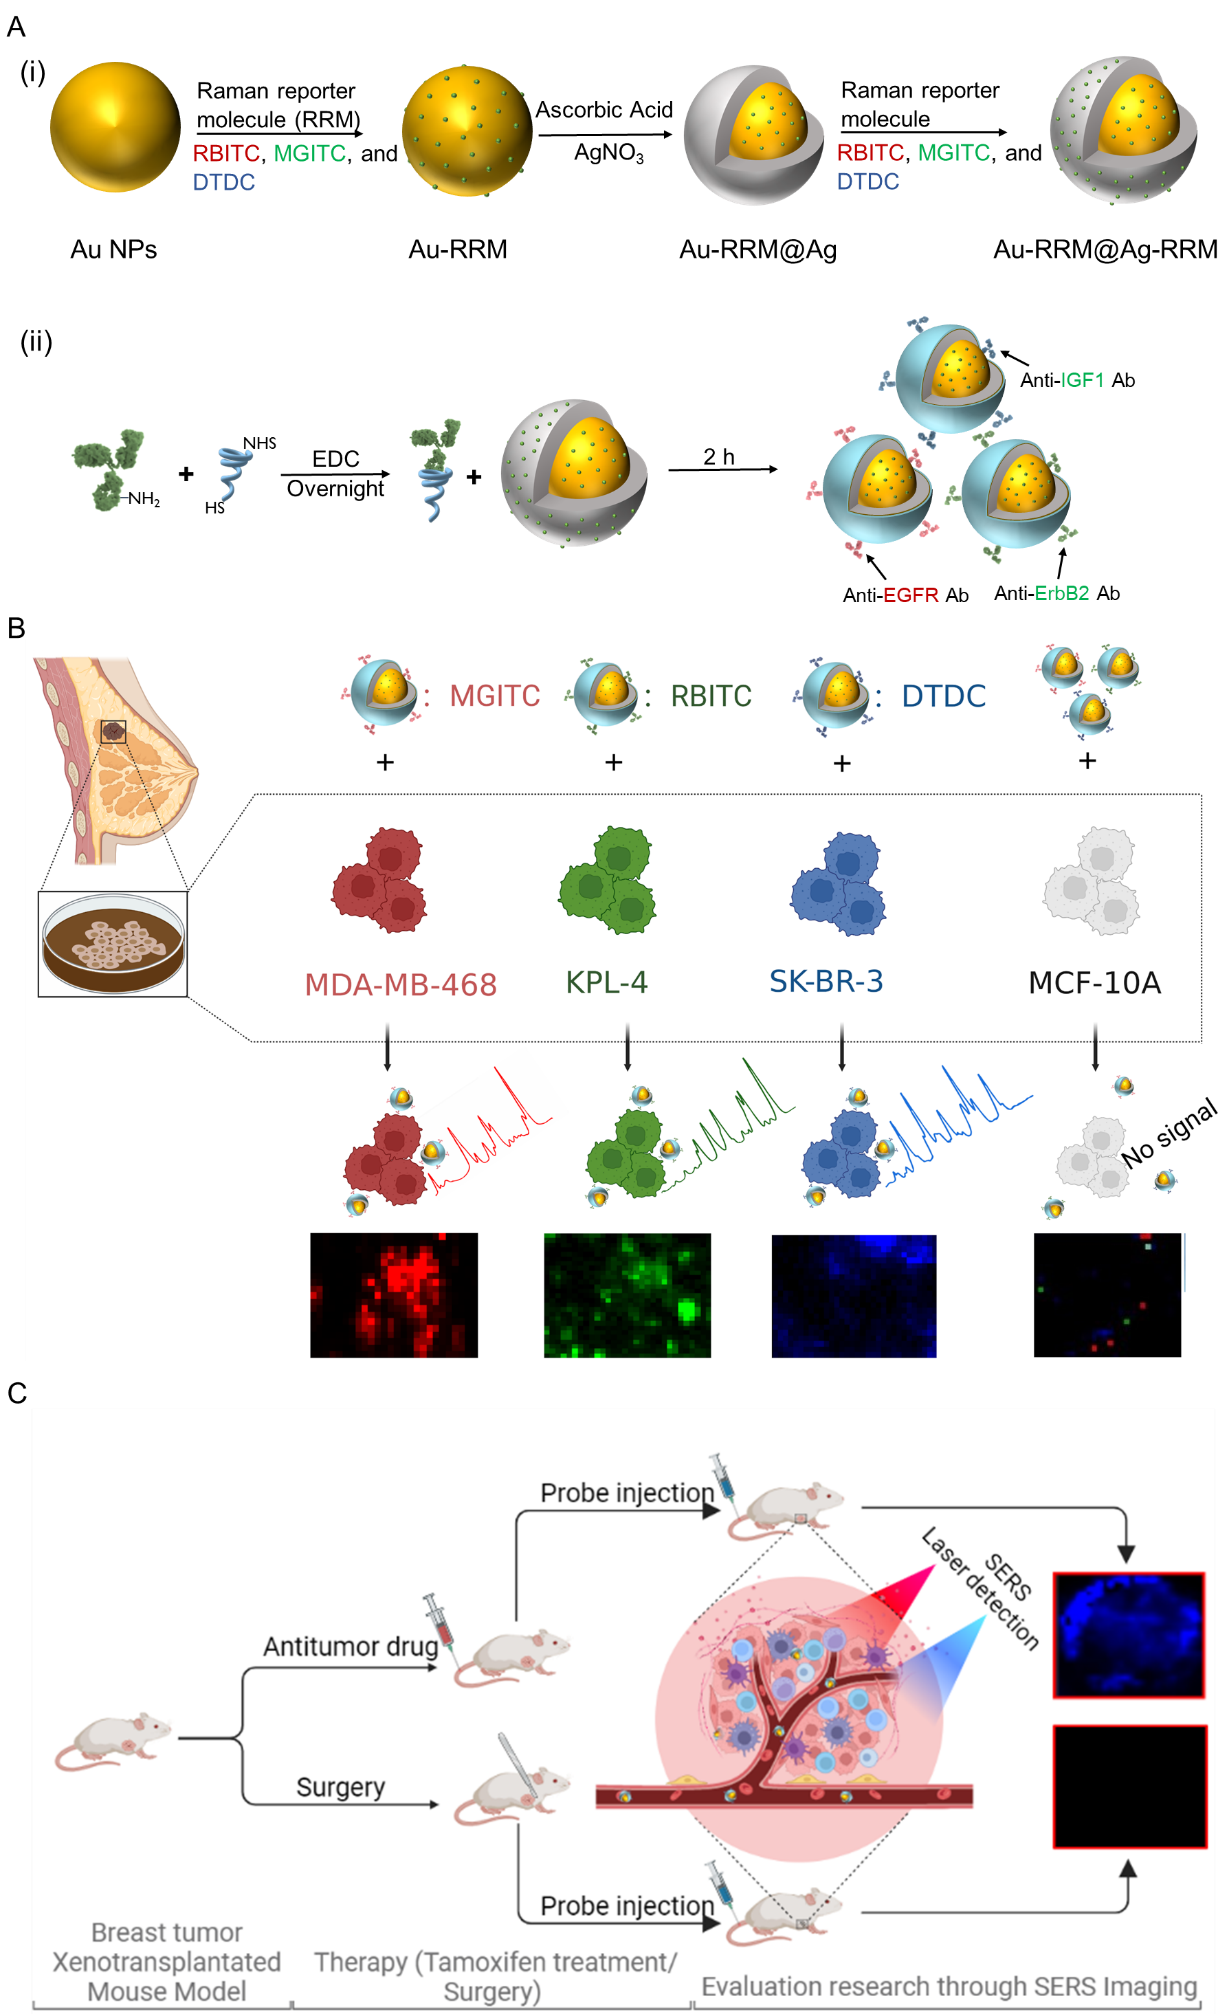
Scheme 1. (A) Schematic illustrations (i) for the fabrication of three different Raman reporter-adsorbed Au@Ag core-shell nanoparticles and the conjugation of PEGylated antibodies on the surface of the above Au@Ag core-shell nanoparticles. (B) Detection of phenotypic biomarkers on cell surface membranes via SERS imaging. (C) The evaluation of after antitumor drug and surgery treatment through SERS imaging. The illustrations (B and C) were created with the help of BioRender.com.
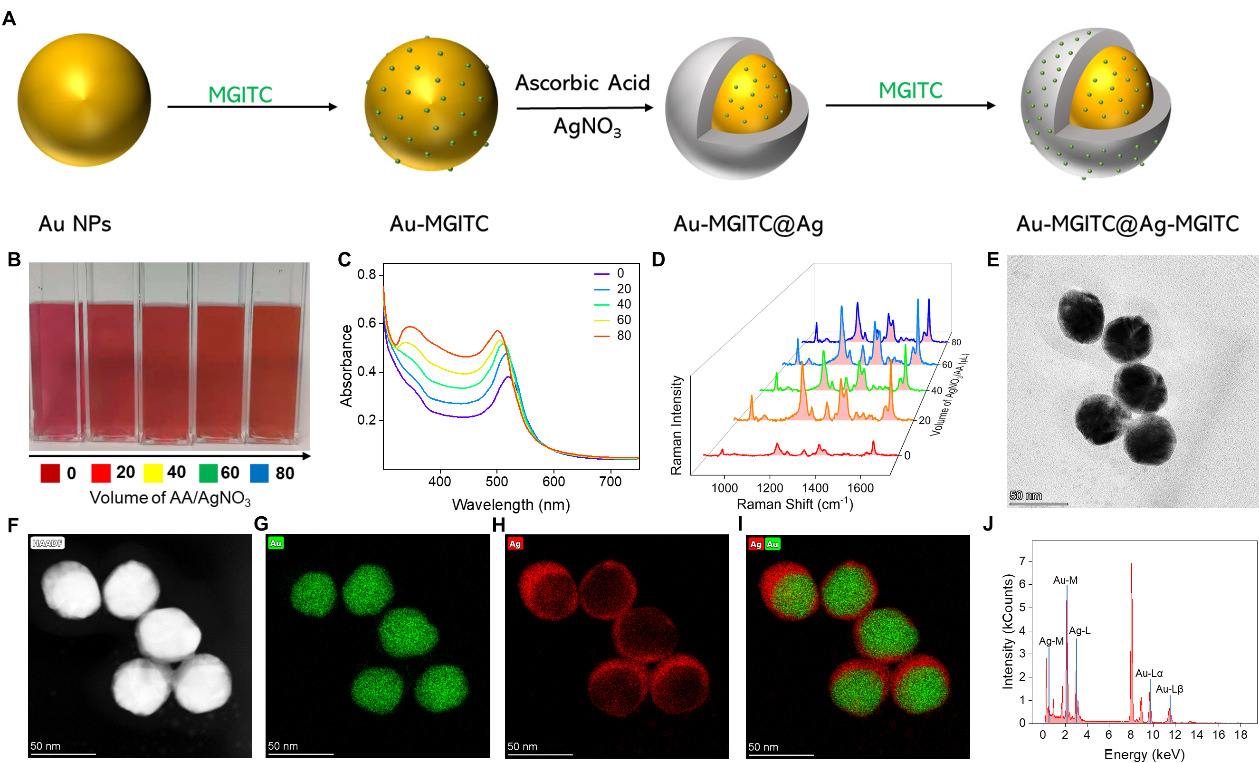
Fig. 1. Preparation and characterization of Au@Ag core-shell nanoparticles. (A) The preparation process of Raman reporter-labeled Au@Ag nanoparticles. (B) Photography for various Ag shell thicknesses. (C) UV-vis spectra of Au@Ag core-shell nanoparticles. (D) SERS signal intensity at 1616 cm-1 for different volumes of silver nitrate and ascorbic acid solution. (E) TEM image of Au@Ag nanoparticles for the volume of silver staining solution at 60 μL. (F-J) HAADF-STEM and EDS elemental maps of Au@Ag nanoparticles display clear core-shell geometry.
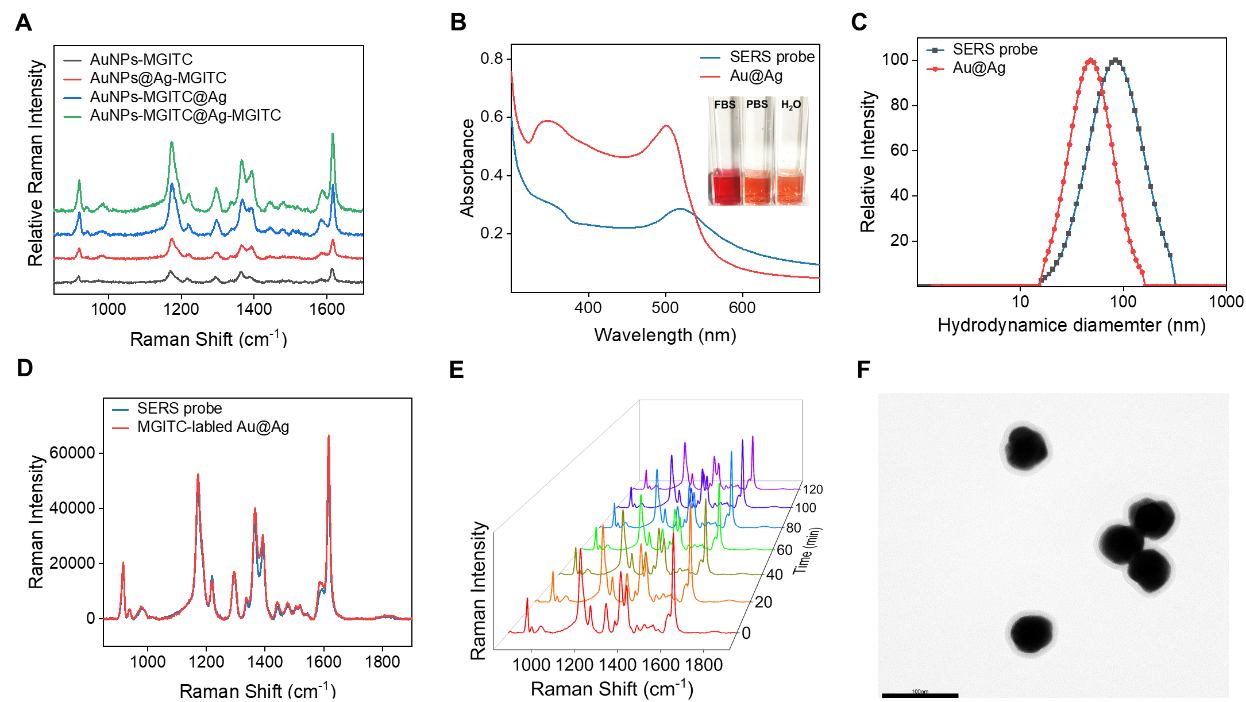
Fig. 2. (A) Selection of different types of SERS probes. Characterization of SERS probes: (B) UV-vis spectra, insert: photographs of SERS probes in FBS, PBS and H2O, (C) DLS distributions, (D) SERS spectra of nanoparticles before (red) and after (black) antibody conjugation, (E) Stability test of SERS signal intensity of SERS probes during incubation in 100% FBS for 2 h, (F) TEM image of SERS probe. The scale bar is 100 nm
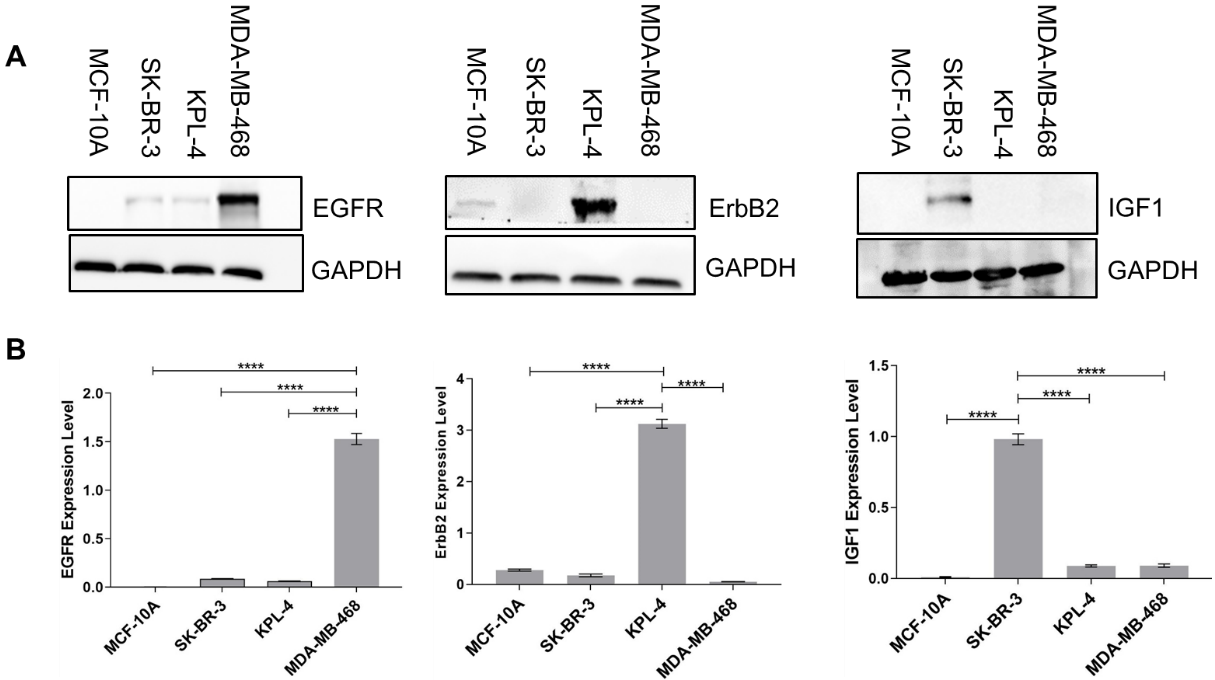
Fig. 3. (A) Western blot analysis for EGFR, ErbB2 and IGF1 biomarkers expressed in MD-MDA-468, KPL-4 and SK-BR-3 breast cancer cells and MCF-10A normal breast cells, respectively, GAPDH used as the internal standard. (B) Densitometric analysis of A, the optical density of biomarkers normalized against GAPDH (n = 3, mean±S. E. M., ****P < 0.0001). Statistical analysis was performed using a one-way ANOVA test.
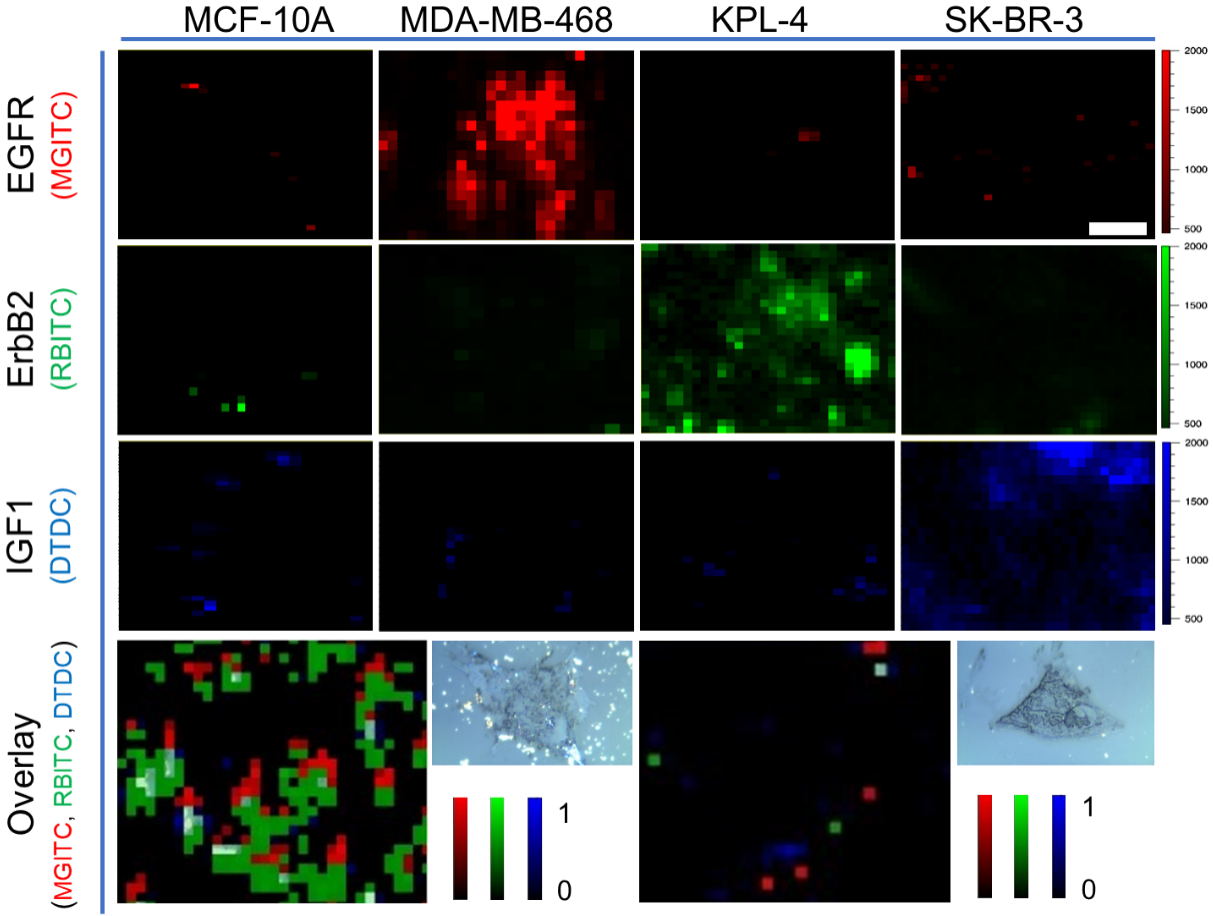
Fig. 4. SERS mapping images of triple biomarkers (EGFR, ErbB2 and IGF1) in MCF-10A, MDA-MB-468, KPL-4 and SK-BR-3 cancer cells after incubation with SERS probes for 2 h. Overlay of representative colors for the distribution of triple biomarkers in KPL-4 cell line (left) and MCF-10A cell line (right). Bright-field images of KPL-4 cell and MCF-10A cell are presented on the right side of SERS mapping images, respectively. The scale bar is 10 μm.
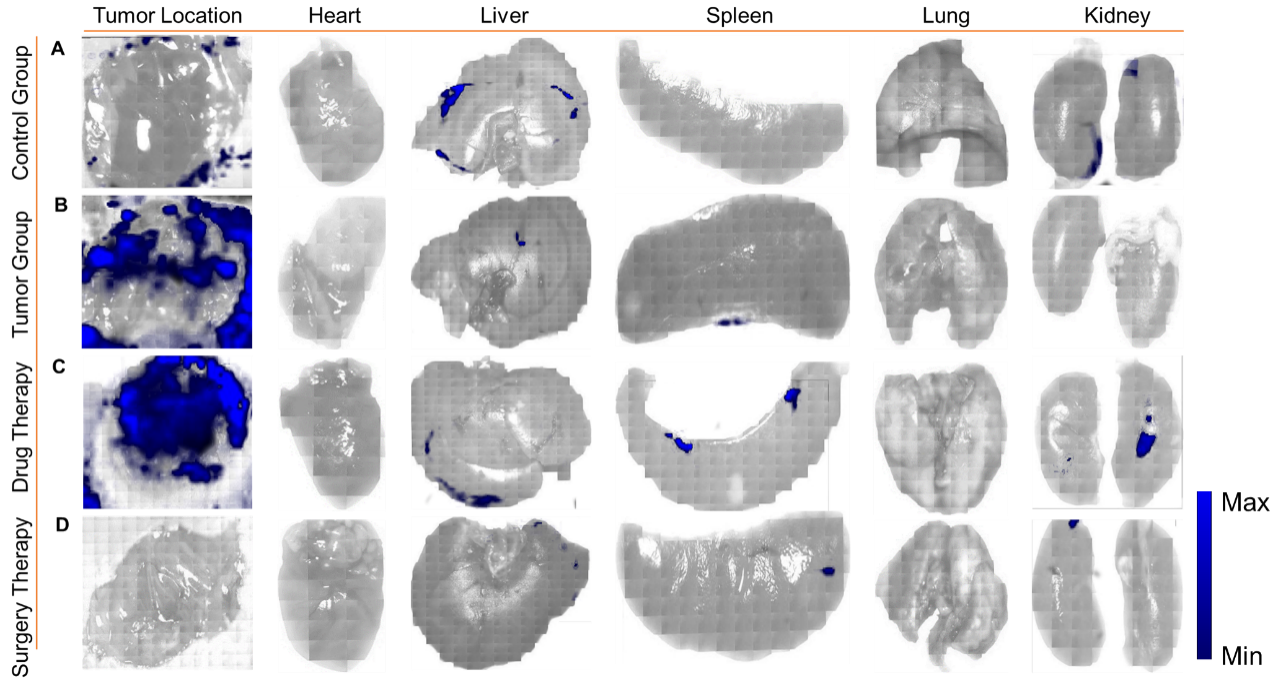
Fig. 5. The evaluation of before and after treatment towards the tumors based on SERS imaging. All the SERS imaging of tumors (the skin tissue in healthy mice) was performed in vivo while the main organs were imaged in vitro. (A) Control group: SERS imaging of right axilla of healthy nude mice and organs. (B) Tumor group: SERS imaging of breast tumor and organs without any treatment. (C) Drug therapy group: SERS imaging of breast tumor and organs after tamoxifen treatment for 15 days. (D) Surgery therapy group: SERS imaging of breast tumor and organs after surgery
Conclusion
In summary, we explored a SERS imaging technique using highly sensitive SERS probes for precisely phenotypic diagnosis at the single cell level and therapeutic evaluation after chemotherapy and surgical treatment. The Au@Ag core-shell nanoparticles embedding double-layer Raman reporters were conjugated with specific antibodies on the surface of the Ag shell to fabricate the SERS probes for the highly sensitive multiplex detection of three phenotypic biomarkers expressed on the surface of breast cancer cell lines. The results demonstrated that the expression level of three biomarkers as well as cancer cell phenotypes could be distinguished specially based on SERS imaging. Furthermore, the therapeutic efficacy after chemotherapy and surgical treatment was evaluated through SERS imaging. We believe that the precisely phenotypic diagnosis and therapeutic evaluation of breast cancers would broaden SERS-based imaging toward a wide range of in vivo biomedical applications.

