Chemistry - An Asian Journal , May 2022, e202200388,Txet Full
Lingchao He【何令超】1,3, Heng Liu【刘恒】2,3,*, Ziyi Cheng【程子译】2,3, Fabiao Yu【于法标】1,2,3,*
1 College of Chemistry and Chemical Engineering, Qufu Normal University, Qufu 273165, China
2 Department of Radiotherapy, Key Laboratory of Hainan Trauma and Disaster Rescue, The First Affiliated Hospital of Hainan Medical University, Hainan Medical University, Haikou, 571199, China
3 Key Laboratory of Emergency and Trauma, Ministry of Education, College of Emergency and Trauma, Hainan Medical University, Haikou 571199, China
https://doi.org/10.1002/asia.202200388
 Abstract
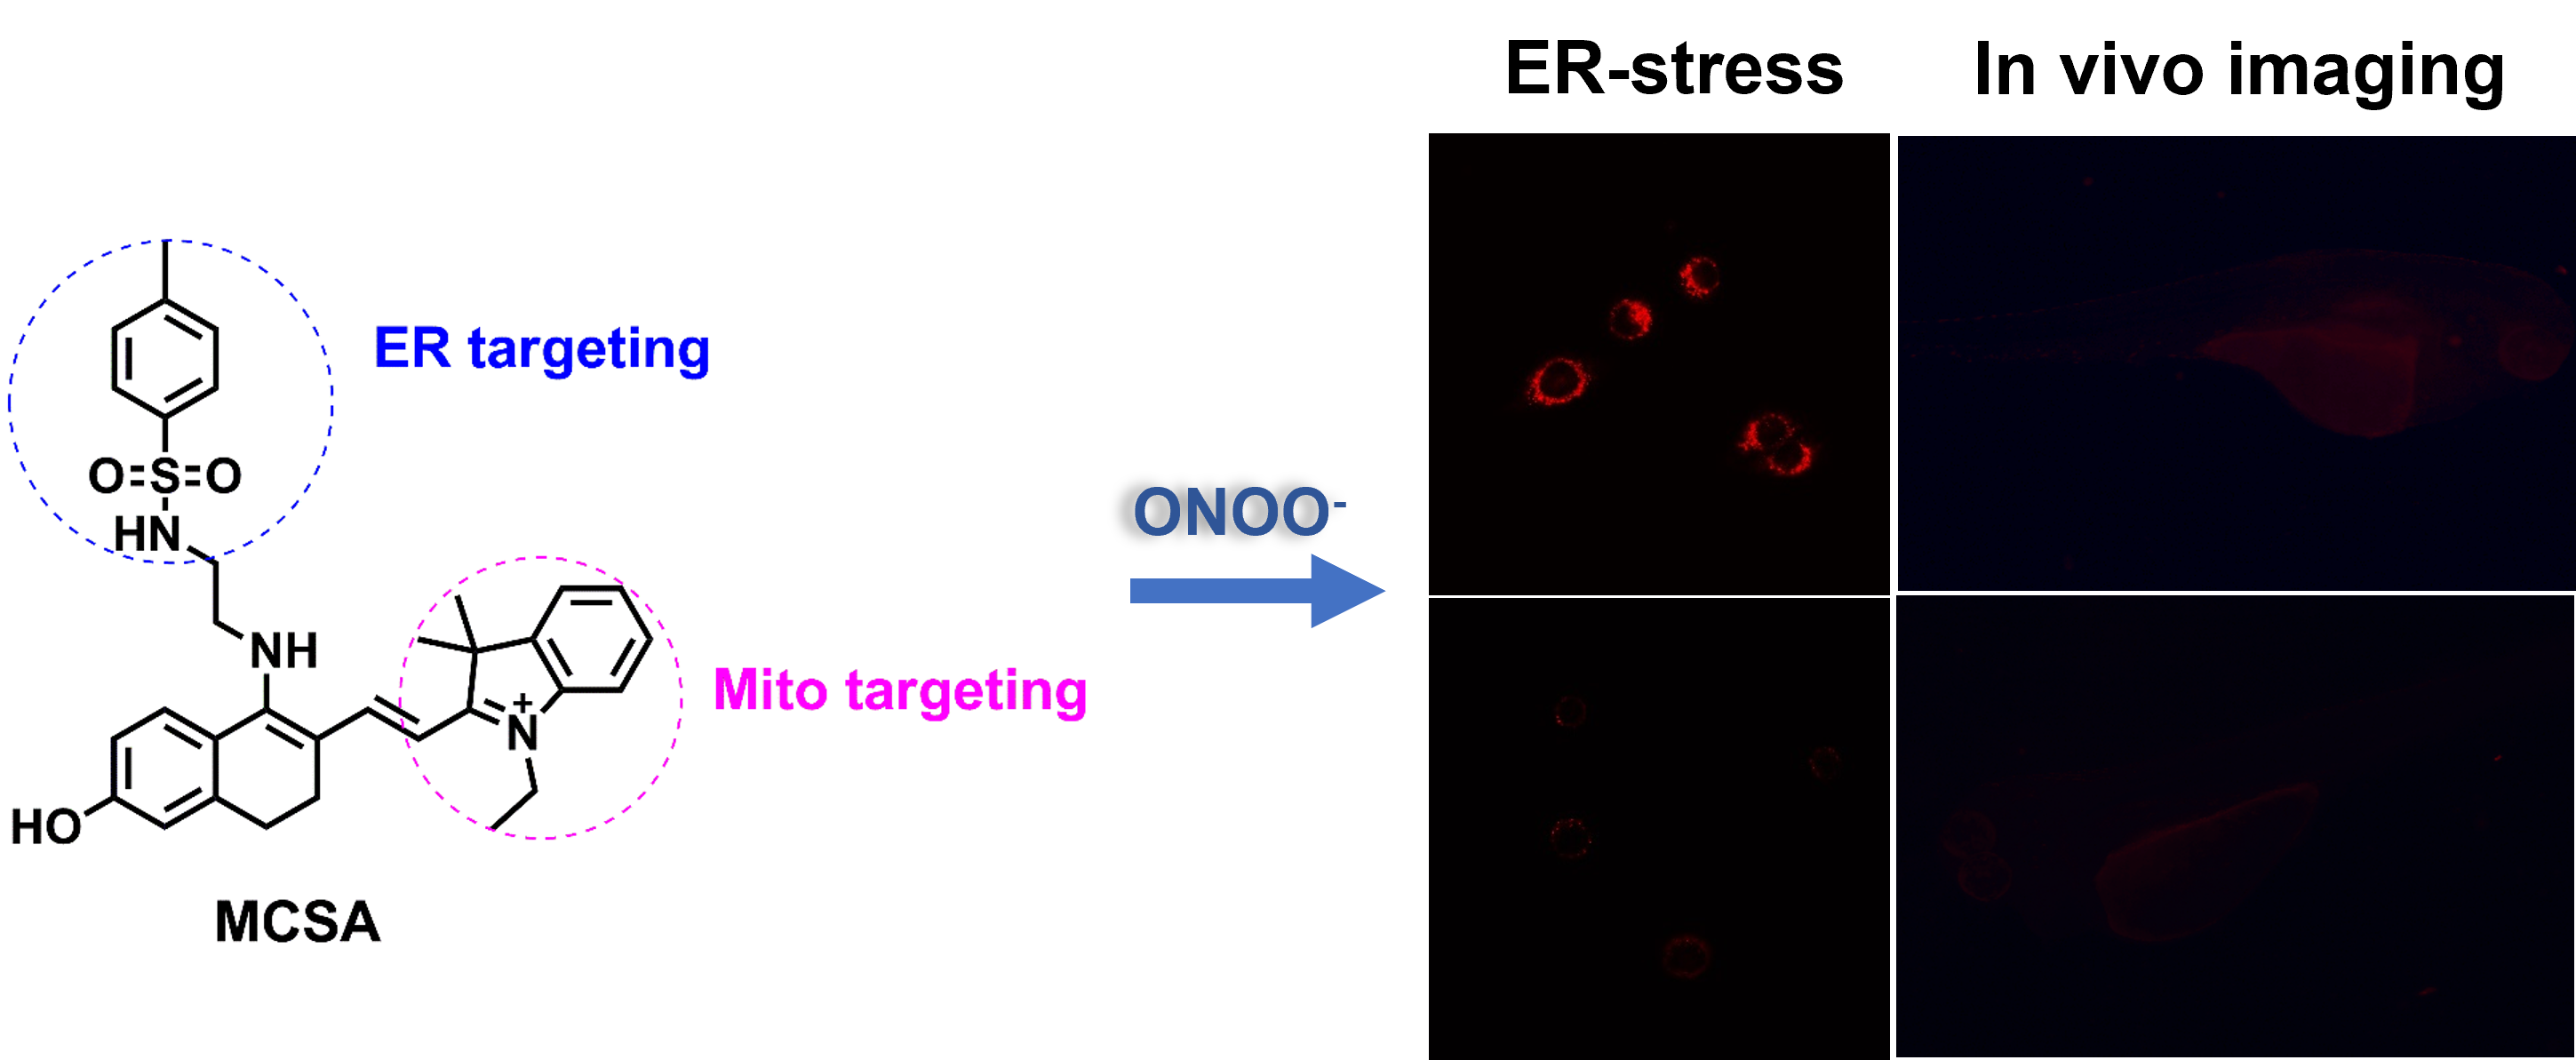
Peroxynitrite (ONOO-) is one of the important reactive oxygen species, which plays a vital role in the physiological process of intracellular redox balance. Revealing the biological functions of ONOO- will contribute to further understanding of the oxidative process of organisms. In this work, we designed and synthesized a novel red-emitting fluorescent probe MCSA for the detection of ONOO-, which could rapidly respond to ONOO- within 250 s and exhibited high sensitivity to ONOO- with a low detection limit of 78 nM. Co-localization experiments demonstrated MCSA had the ability to localize into the mitochondria and endoplasmic reticulum. What’s more, MCSA enabled monitoring ONOO- level changes during tunicamycin-induced endoplasmic reticulum stress. We have also successfully achieved the visual detection of exogenous and endogenous ONOO- in living cells and zebrafish. This work presented a chemical tool for imaging ONOO- in vitro and in vivo.
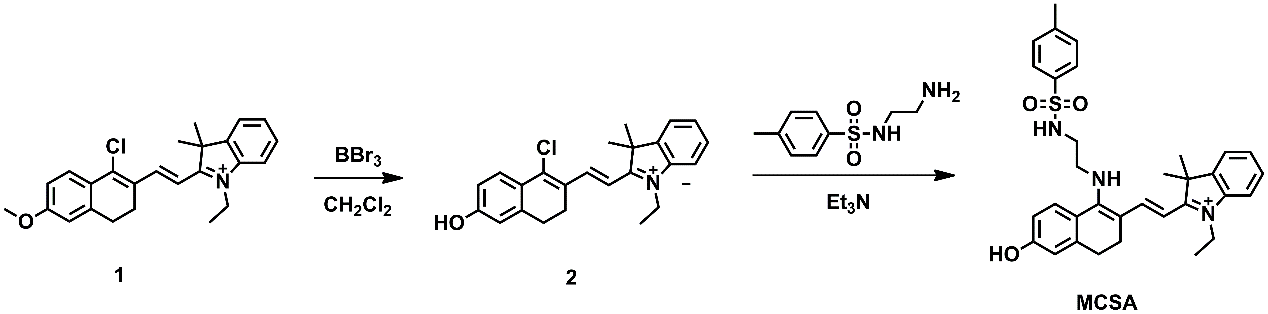
Scheme 1. Synthetic approaches to MCSA.
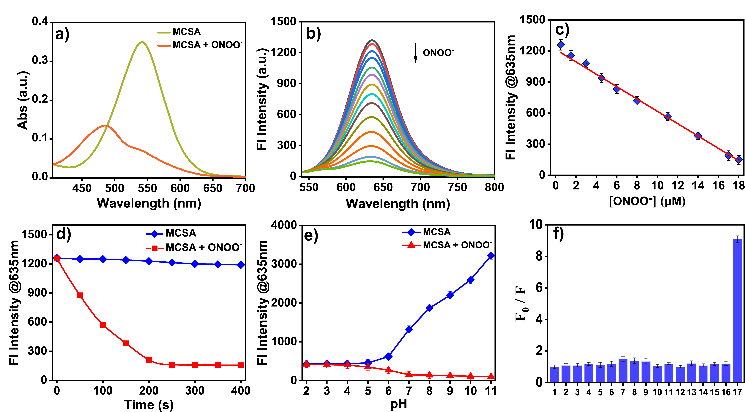
Figure 1. Spectral properties of MCSA. (a) Absorption spectra of MCSA before and after addition of ONOO-. (b) Fluorescence spectra of MCSA after the reaction with series concentrations of ONOO- (0 - 18 μM). (c) The plot of the linear relationship between the relative fluorescence intensity at 635 nm of MCSA and concentrations of ONOO- (0 - 18 μM). (d) Time-dependent fluorescence intensity of MCSA toward ONOO- (18 μM). (e) Fluorescence intensity at 635 nm of MCSA with and without ONOO- under different pH values. (f) Fluorescence responses of MCSA to different potential interfering species: 1. blank, 2. Na+ (100 µM), 3. Ca2+ (100 µM), 4. Zn2+ (100 µM), 5. Fe3+ (20 µM), 6. NO2- (50 µM ), 7. NO (50 µM), 8. NaClO (20 µM), 9. H2O2 (100 µM), 10. O2•− (100 µM), 11. ·OH (50 µM), 12. Na2S2O3 (200 µM), 13. 1O2 (50 µM), 14. Citric acid (50 µM), 15. Cys (500 µM), 16. GSH (500 µM), 17. ONOO- (18 µM).
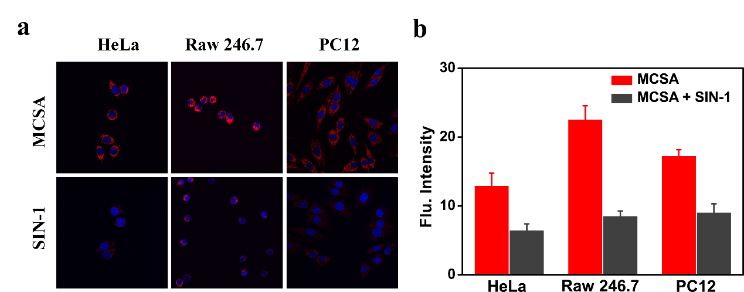
Figure 2. Imaging exogenous ONOO− in different cells. (a) Confocal laser scanning microscopy of 10 μM MCSA-loaded HeLa, Raw 246.7, PC12 cells only, or treated with SIN-1 (0.5 mM) for 30 min. The red channel was collected in the range of 600−700 nm (λex = 520 nm) and the DAPI channel was collected in the range of 415-550 nm (λex = 405 nm). (b) Relative red fluorescence intensities of MCSA labelled cells in (a) (n = 3).
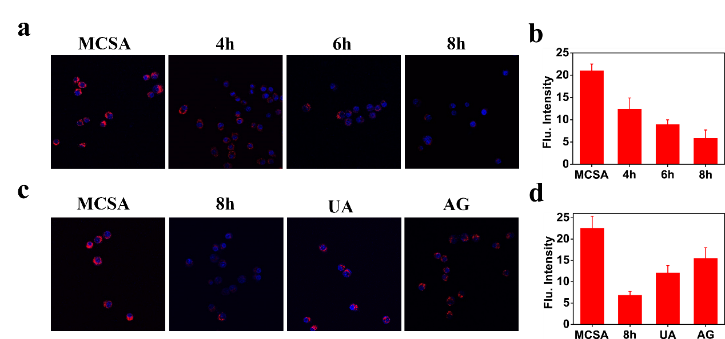
Figure 3. Imaging endogenous ONOO− in RAW264.7 cells. (a) The cells pretreated with LPS, IFN-γ for 4 h, 6 h, 8 h, then PMA for 30 min, were incubated with MCSA (10 μM). (b) Relative red fluorescence intensities of MCSA labelled cells in (a) (n = 3). (c) The cells were pretreated with LPS, IFN-γ for 8 h, PMA for 30 min, UA or AG for 30 min, then incubated with MCSA for 30 min. (d) Relative red fluorescence intensities of MCSA labelled cells in (c) (n = 3). The red channel was collected in the range of 600-700 nm (λex = 520 nm) and the DAPI channel was collected in the range of 415-550 nm (λex = 405 nm).

Figure 4. Co-localization of MCSA and ER-tracker red, Mito-tracker green in HeLa cells. The cells were co-incubated with MCSA (10 μM, λex =520nm, λem = 600-700 nm ), and (a) ER-tracker red (500 nM, λex = 561 nm, λem = 580-630 nm); (d) Mito-tracker green (500 nM, λex = 488 nm, λem = 500-600 nm). (b, e) Intensity correlation plot of MCSA and ER-tracker red, Mito-tracker green. (c, f) Intensity 3D waterfall profiles of MCSA and ER-tracker red, Mito-tracker green within the linear ROI.
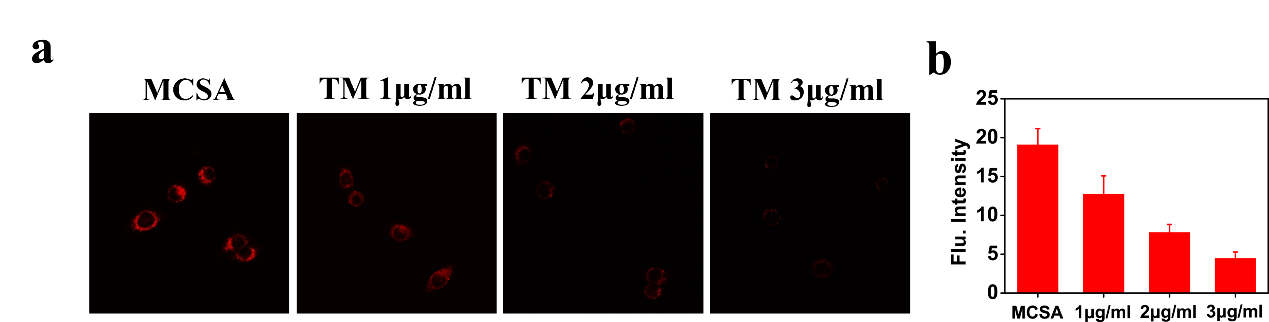
Figure 5. Imaging ONOO− in HeLa cells during endoplasmic reticulum stress. (a) The cells pretreated with TM (0, 1, 2, 3 μg/ml) for 8 h, were incubated with MCSA (10 μM). (b) Relative fluorescence intensities of MCSA labelled cells in (a) (n = 3).
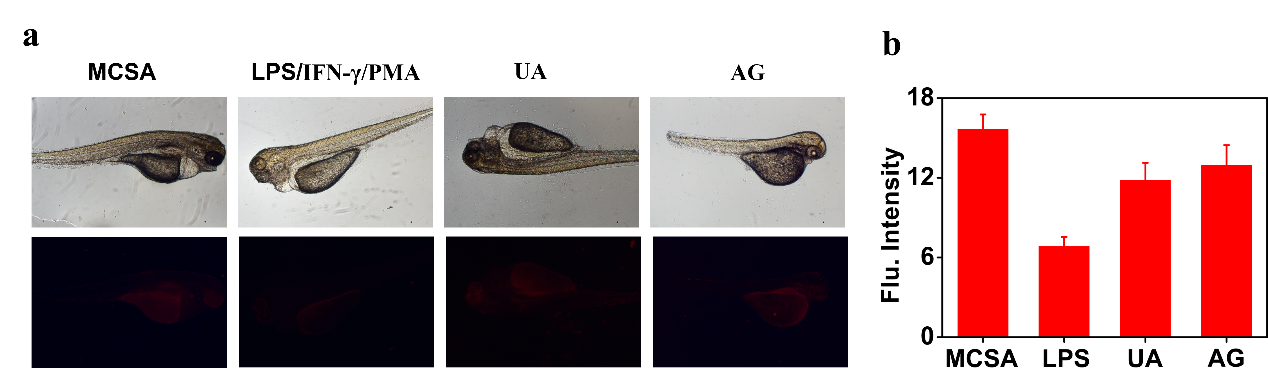
Figure 6. Imaging endogenous ONOO− in zebrafish. (a) The zebrafish were pretreated with LPS (2 µg/ml), IFN-γ (100 ng/ml), PMA (10 nM), UA (100 μM) or AG (1 mM) for 30 min, then incubated with MCSA for 30 min. (b) Relative red fluorescence intensities of MCSA labelled zebrafish in (a) (n = 3).
Conclusion
In summary, we have successfully constructed a red-emitting fluorescent probe MCSA for the detection of ONOO-, exhibiting fast response, high selectivity over other interfering species and sensitivity with a low detection limit in PBS buffer solution. Using MCSA, we have achieved that real-time visualization of exogenous ONOO- in different types of cell lines. Colocalization experiment results demonstrated that MCSA enabled selectively targeting intracellular mitochondria and endoplasmic reticulum. More importantly, MCSA was applicable for tracking level fluctuations of ONOO- during TM-induced endoplasmic reticulum stress. Moreover, MCSA could be applied for imaging endogenously produced ONOO- in zebrafish. Above all, we anticipate that MCSA can be used as a chemical tool to aid in the detection and treatment of ONOO--related diseases.