Hui Chen, Ziyi Cheng, Xuejun Zhou, Rui Wang,* and Fabiao Yu*
https://doi.org/10.1021/acs.analchem.1c03646
Abstract
Since visible light (380-650 nm) incident on biological tissues is easily scattered and absorbed by surface tissues, it is not easy to penetrate deep tissues. Near-infrared (NIR, 650-1700 nm) light, known as ‘biological window/therapeutic window’, has attracted more and more attention due to its longer wavelength, less scattering and absorption to tissues, resulting in higher biological tissue penetration efficiency. The advent of NIR active surface enhanced Raman scattering (SERS) with ultrasensitive analytical capacity, manifests high specificity and sensitivity for biomedical analysis such as visualization of various intracellular biomolecules, disease diagnosis, image-guided surgical resection of the tumors and phototherapy. In this overview, we firstly summarize recent advances of different probe materials by evaluating the safety and efficacy of substrate materials and Raman reporters, then integrating different probe materials and probe functions to obtain optimized sensitivity and reproducibility for the detection of single-molecule level and subcellular imaging. Next, reviewing its application in visual detection and diagnosis in the pre-clinical and clinical biomedical field. Finally, we retrospect the SERS image-guided therapy in NIR region and discuss the related potential and challenges in the future.
The abnormal fluctuations of various biomarkers (such as intracellular nucleic acid, lipid, protein and pH, etc.) can be used as valuable diagnostic indicators for monitoring the physiological and pathological processes.1-4 Traditional detection and imaging methods often face various deficiencies and new challenges. Thus, the sensing and imaging techniques with properties of non-contact, real-time, deep tissue penetration and high spatial resolution are urgently needed, which can display intrinsic chemical components in tissues and provide useful information for biomedical applications. In the last decades, surface-enhanced Raman scattering (SERS) has received more and more attention owing to its ultrahigh sensitivity and non-invasiveness.5-7 As a powerful vibrational spectroscopic technique, SERS can provide useful information about chemical structure and surrounding environment with enhancement up to 1014-1015. Also, with very narrow peak width, usually a few tenths of the fluorescence peak width, SERS makes multiplexing target detection in single excitation light possible.8-9
Typical SERS detection can be simply divided into two types, namely direct detection without label and indirect method based on SERS labels.7, 10-12 The traditional SERS-based label-free detection can be realized through the direct interactions between the targets and the SERS-based nanostructure to obtain the vibrational spectrum information of the targets, which is limited to the complicated signal assignment, poor throughput, and limited sensitivity.7, 10 Indirect detection usually uses Raman reporter molecules to label the SERS substrates, and results in a strong SERS signal for analyte measurements, which overcomes the deficiencies encountered in the direct detection. The labeled SERS detection can obtain the intrinsic fingerprint signal of specific Raman reporter molecules, which significantly improves the stability of SERS probes and allows highly reproducible quantitative analysis of biomolecules in vitro and in vivo (Figure 1A).
The common SERS detection usually uses laser in the wavelength range of visible region (400-650 nm) as the excitation light. When applied to biological tissues, it produces a large amount of photon scattering and absorption, resulting in limited tissue penetration depth and significant interference from the tissue's autofluorescence.13-14 In order to overcome these difficulties, near-infrared (NIR) light in the two biological windows has gained much more interest for biosensing and in vivo imaging. NIR light can penetrate deep biological tissues compared to visible light owing to the less scattering and absorption at the longer wavelength light for the tissues. NIR window has been further divided into two regions, categorized as the first (650-900 nm) and the second (1000-1700 nm) NIR window.15 Accurate signal comes from efficient CCD detector. Within the spectral range of 900 nm, it is mainly defined by the silicon (Si) CCD detector, but its detection efficiency drops after 900 nm. Since the quantum efficiency of indium gallium arsenide (InGaAs) detector begins to increase dramatically after 1000 nm, the spectral boundary larger than 1000 nm is mainly defined by the InGaAs detector, both of which have low quantum efficiency in the range of 900-1000 nm (Figure 1B and 1C).16 Additionally, the selection of NIR window for SERS detection shows many advantages: (i) deep tissue penetration due to negligible absorption and low scattering in NIR; (ii) less tissue interference spontaneous fluorescence; (iii) minimal
tissue damage (Figure 1D and 1E).16-17 These integrated advantages are suitable for biosensing and bioimaging in preclinical and clinical applications. Thus, when SERS probe was applied on active biosensor platform, it should be committed to using NIR light for excitation and low power value to prevent possible damage of living cells, and minimize the time of signal accumulation, so as to obtain accurate information of dynamic physiological and pathological process of living cells.
Although many impressive developments have been achieved on NIR SERS and its biomedical applications, Before NIR SERS is applied to practical clinical diagnosis, much efforts are needed to be devoted to improving the reliability and sensitivity of SERS detection in biological systems. The following key challenges need to be addressed, which enable SERS to address problems that other bioanalytical techniques cannot solve:
(1) Low detector efficiency in the NIR region and high cost of detector in the NIR II region;
(2) Difficulty in designing nanostructures with high SERS activity;
(3) Less Raman reporter molecules in NIR region, especially in NIR II region.
Herein, we focus on reviewing the most recent advances of NIR SERS probe in biosensing and bioimaging application. To guide the reader to better understand NIR SERS and its factors that may interfere the highly sensitive detection in biomedical applications, we first propose the key challenges to perform highly sensitive NIR SERS measurement including CCD detector and design of active NIR SERS probes. Thereafter, we introduce the fundamental design principle of NIR SERS for highly sensitive detection, covering active NIR SERS substrates, NIR Raman reporter molecules and surface encapsulation. Recently developed biosensing and bioimaging strategies in NIR biowindow, such as different molecules including nucleic acid, proteins, and small molecules, pathogens, and various biological processes, etc., are systematically reviewed. Through the innovative fabrication of NIR-active SERS probes and subsequent modification, various SERS imaging-guided therapy platforms are properly designed, demonstrating preferable in vitro and in vivo therapeutic performance. Finally, we conclude the future challenges and prospects of NIR-active SERS probes in both two near-infrared biowindows. This review aims to better understand NIR SERS biosensing and bioimaging and motivate their further clinical applications.
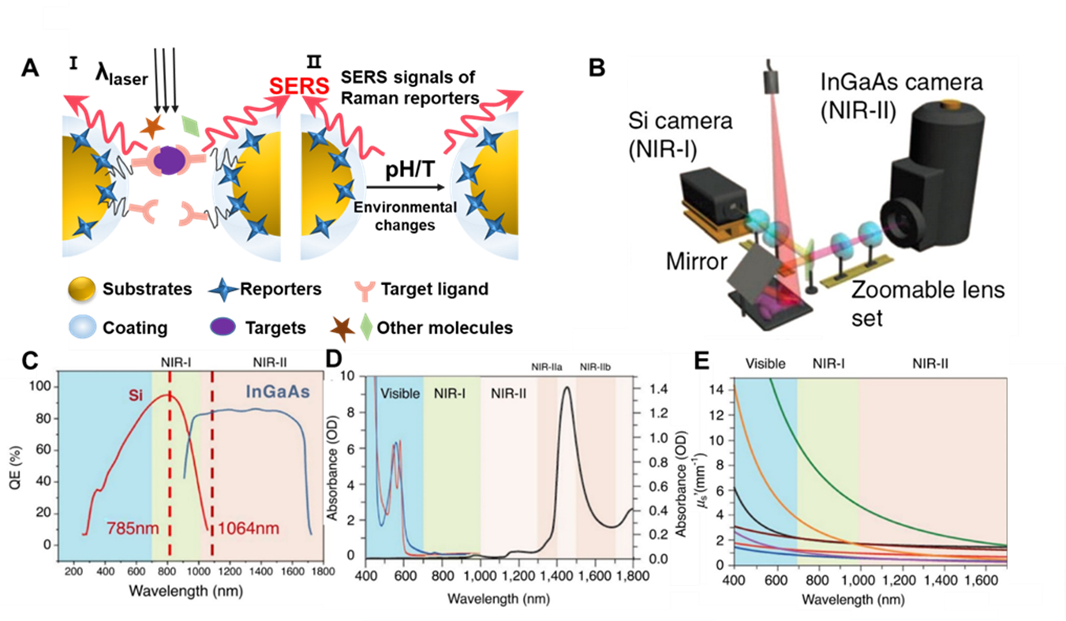
Figure 1. (A) Schematic diagram of indirect SERS detection. In the figure (i), the biocompatible SERS nanoprobe combines reporter molecules on the substrate surface, binding targeted ligands under the protection of the peripheral coating. When the target molecule appears near the hot spot generated between two metal substrates, a significantly enhanced SERS signal can be obtained. In the figure (ii), when the reaction system environment changes, such as pH or temperature changes, SERS signal of the reporter molecule will change. (B) A schematic of the imaging setup for simultaneous detection of both NIR-I and NIR-II photons using Si and InGaAs cameras. (Reprinted from Adv. Drug Deliv. Rev., Vol. 65, Gong, H.; Peng, R.; Liu, Z. Carbon nanotubes for biomedical imaging: the recent advances, pp. 1951-1963 (ref 16). Copyright 2013, with permission from Elsevier.) (C) Sensitivity curves for typical cameras based on Si or InGaAs, which are sensitive in the first and second near-infrared windows, respectively. The excitation wavelengths at 785 nm and 1064 nm are indicated by vertical dotted lines. (D) Absorbance of oxygenated (red curve) and deoxygenated (blue curve) hemoglobin in the visible and NIR spectrum, together with water absorbance (black curve) at 1400-1500 nm. (E) Plots of the scattering attenuation coefficient as a function of wavelength for various ex vivo tissues (from top to bottom: green curve = brain tissue, yellow curve = intralipid tissue phantom, black curve = skin, brown curve = cranial bone, purple curve = mucous tissue, red curve = subcutaneous tissue, blue curve = muscle tissue). (Reprinted from Curr. Opin. Chem. Biol., Vol. 45, Lane, L. A.; Xue, R.; Nie, S. Emergence of two near-infrared windows for in vivo and intraoperative SERS, pp. 95-103 (ref 14). Copyright 2018, with permission from Elsevier.)
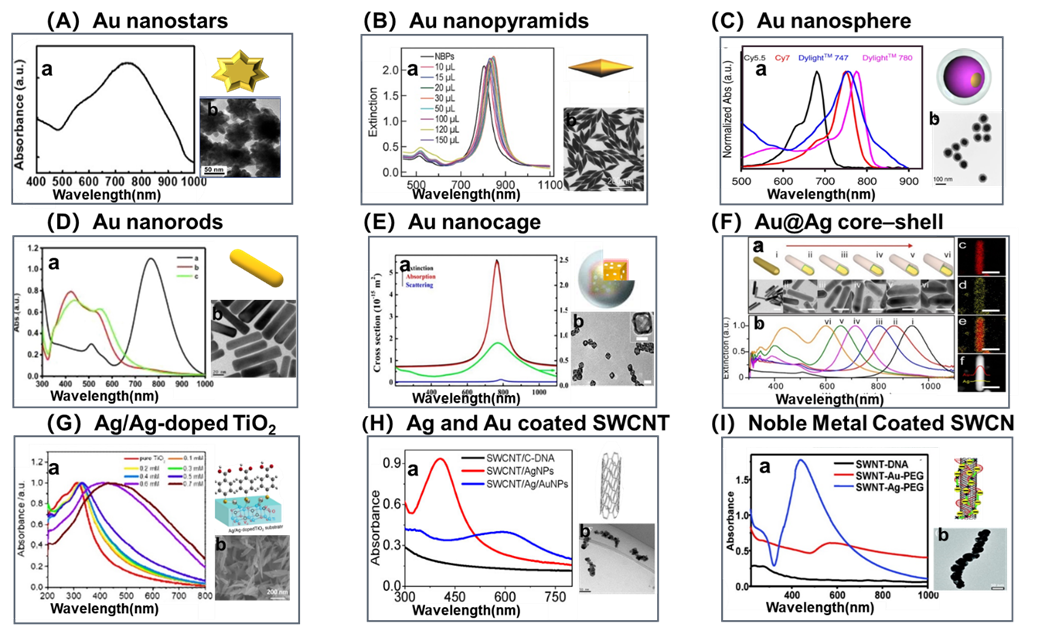
Figure 2. Representative nanosubstrates of NIR active SERS probes: (A) a. UV–vis absorption spectra showing the SPR peak of the gold nanostar at ~745 nm. b. Representative SEM image of a gold nanostar. (Reproduced from Park, S.; Lee, J.; Ko, H. ACS Appl. Mater. Interfaces. 2017, 9, 44088-44095 (ref 26). Copyright 2017 American Chemical Society.) (B) a. Extinction spectra of the Au NBP and Au NBP/mSiO2 nanostructure samples produced with 10, 15, 20, 30, 50, 100, 120, and 150 μL of the CTAB solution (0.1 M), respectively. b. Typical TEM images of Au NBPs (scale bar: 200 nm). (Reproduced from Selective Pd Deposition on Au Nanobipyramids and Pd Site-Dependent Plasmonic Photocatalytic Activity, Zhu, X.; Jia, H.; Zhu, X. M.; Cheng, S.; Zhuo, X.; Qin, F.; Yang, Z.; Wang, J. Adv. Funct. Mater., Vol. 27, Issue 22 (ref 27). Copyright 2017 Wiley.) (C) a. UV-vis NIR spectra of 4 different fluorophores modified Au nanosphere. b. Typical TEM images (Reprinted by permission from Macmillan Publishers Ltd: NATURE COMMUNICATIONS, Pal, S.; Ray, A.; Andreou, C.; Zhou, Y.; Rakshit, T.; Wlodarczyk, M.; Maeda, M.; Toledo-Crow, R.; Berisha, N.; Yang, J.; Hsu, H.-T.; Oseledchyk, A.; Mondal, J.; Zou, S.; Kircher, M. F., Nat. Commun. 2020, 10, 1926 (ref # 28). Copyright 2019.) (D) a. UV absorption spectra of AuNRs (a), Au@AgNRs (b), and Au@AgNRs@BSA (c). Scale bar=20 nm. b. Typical TEM images of AuNRs. (Reprinted from Talanta, Vol. 150, Yue, J.; Liu, Z.; Cai, X.; Ding, X.; Chen, S.; Tao, K.; Zhao, T. Bull serum albumin coated Au@Agnanorods as SERS probes for ultrasensitive osteosarcoma cell detection, pp. 503-509 (ref 71). Copyright 2016, with permission from Elsevier.) (E) a. UV-vis NIR spectra of AgNCs, AuNCs, AuNCs/SiO2 NPs. Experimental results for the extinction spectrum (green curve) and calculated results for the extinction (black curve), absorption (red curve), and scattering cross-sections (blue curve) of AuNCs/SiO2 NP with an outer edge length of 29 nm, a wall thickness of 3.5 nm, and a SiO2 shell thickness of 17 nm. b. Typical TEM images. (Reproduced from Wen, S.; Miao, X.; Fan, G. C.; Xu, T.; Jiang, L. P.; Wu, P.; Cai, C.; Zhu, J. J. ACS Sens. 2019, 4, 301-308 (ref 131). Copyright 2019 American Chemical Society.) (F) a. UV-vis NIR spectra of metallic Au@Ag core–shell rodlike nano-matryoshkas (RNMs) with embedded Raman reporters 4-nitrobenzenethiol (NBT). b. Typical TEM images of NBT-RNMs with different Ag shell thicknesses (scale bar: 50 nm). (c) Au, (d) Ag, (e) the overlay of Au and Ag, and (f) the corresponding STEM image of a single NBT-RNM. (Reproduced from Jin, X.; Khlebtsov, B. N.; Khanadeev, V. A.; Khlebtsov, N. G.; Ye, J. ACS Appl. Mater. Interfaces 2017, 9, 30387-30397 (ref 67). Copyright 2017 American Chemical Society.) (G) Characteristics of Ag/Ag-doped TiO2 substrates: a. UV-vis absorption spectra of as-synthesized of pure TiO2 and Ag/Ag-doped TiO2 substrates prepared with different concentrations of AgNO3(0.1-0.7). b. SEM images of Ag/Ag-doped TiO2 substrates prepared with different concentrations of AgNO3 (0.7 mM). (Reprinted by permission from Macmillan Publishers Ltd: NATURE COMMUNICATIONS, Zhou, L.; Zhou, J.; Lai, W.; Yang, X.; Meng, J.; Su, L.; Gu, C.; Jiang, T.; Pun, E. Y. B.; Shao, L.; Petti, L.; Sun, X. W.; Jia, Z.; Li, Q.; Han, J.; Mormile, P., Nat. Commun. 2020, 11, 1785 (ref # 49). Copyright 2020.) (H) a. UV-vis absorption spectra of the SWCNT/C-DNA, SWCNT/AgNPs, and SWCNT/Ag/AuNPs nanoconjugate. b. HADDF-STEM imaging of the Ag and Au of the SWCNT/Ag/AuNPs nanoconjugate. (Reproduced from Qin, X.; Si, Y.; Wang, D.; Wu, Z.; Li, J.; Yin, Y. Anal. Chem. 2019, 91, 4529-4536 (ref 59). Copyright 2019 American Chemical Society.) (I) a. UV/vis/NIR absorption spectra of SWNT-DNA (10 nm), SWNT-Au-PEG, and SWNT-Ag-PEG solutions (1 nm by SWNT content). b. TEM images of the SWNT-Ag-PEG nanocomposite (scale bar: 50 nm). (Reproduced from Wang, X.; Wang, C.; Cheng, L.; Lee, S. T.; Liu, Z. J. Am. Chem. Soc. 2012, 134, 7414-7422 (ref 76). Copyright 2012 American Chemical Society.)
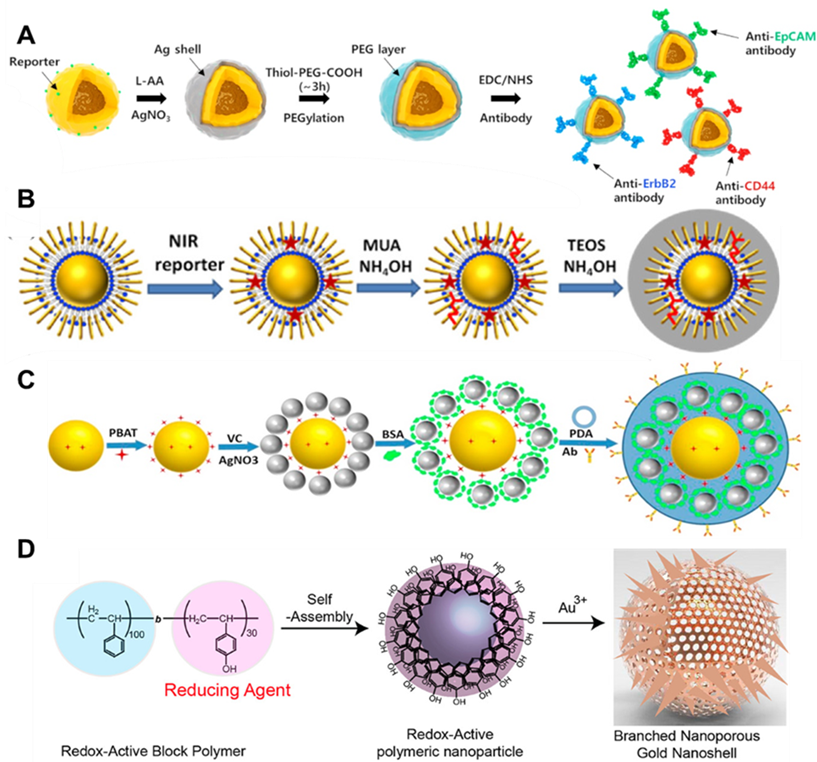
Figure 3. The typical types of capsulations for SERS probes: (A) PEG coating Ag-Au hollow nanospheres. (Reprinted from Talanta, Vol. 164, Choi, N.; Dang, H.; Das, A.; Sim, M. S.; Chung, I. Y.; Choo, J. SERS biosensors for ultrasensitive detection of multiple biomarkers expressed in cancer cells, pp. 112326 (ref 68). Copyright 2020, with permission from Elsevier.) (B) Silica-Coated waxberry-like NPs@SiO2 SERRS probes. (Reproduced from Yin, Y.; Mei, R.; Wang, Y.; Zhao, X.; Yu, Q.; Liu, W.; Chen, L. Anal. Chem. 2020, 92, 14814-14821 (ref 69). Copyright 2020 American Chemical Society.) (C) Bovine serum albumin (BSA) and polydopamine (PDA) coated on the PBAT- Au@Ag. (Reprinted from Talanta., Vol. 172, Chen, M.; Zhang, L.; Gao, M.; Zhang, X. High-sensitive bioorthogonal SERS tag for live cancer cell imaging by self-assembling core-satellites structure gold-silver nanocomposite, pp. 176-181 (ref 72). Copyright 2017, with permission from Elsevier.) (D) Self-assembly of redox-active amphiphilic diblock copolymers. (Reproduced from Song, J.; Yang, X.; Yang, Z.; Lin, L.; Liu, Y.; Zhou, Z.; Shen, Z.; Yu, G.; Dai, Y.; Jacobson, O.; Munasinghe, J.; Yung, B.; Teng, G. J.; Chen, X. ACS Nano 2017, 11, 6102-6113 (ref 73). Copyright 2017 American Chemical Society.)
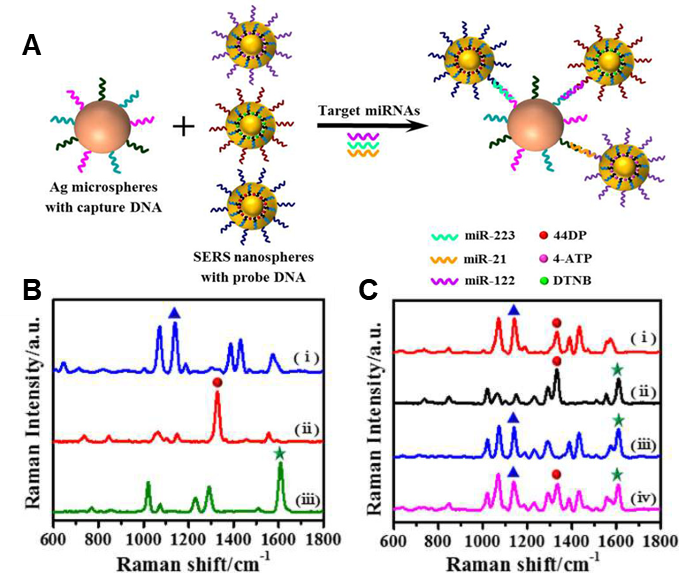
Figure 4. Strategies of NIR-active SERS Analysis for Biomolecules: (a) Schematic illustration of the multiplex SERS assay for triple-target miRNA detection. Three types of SERS nanoprobes were prepared via the functionalization of detection DNA on Au-RNNPs encoded by 44DP, 4-ATP and DTNB. Each type of target miRNA was captured by the corresponding capture DNA anchored on Ag-HMSs, followed by hybridization with its own SERS nanoprobe, leading to the formation of co-assembled multiple sandwich complexes. (b)-(c): SERS spectra of the nanoprobes obtained in the presence of single and multiple miRNAs. SERS spectra b-i, b-ii, and b-iii were obtained for the detection of target miR-21, miR-122, and miR-223, respectively. SERS spectra c-i, c-ii, c-iii, and c-iv were obtained for the multiplexed detection of a mixture of miR-21/miR-122, miR-122/miR-223, miR-21/miR-223, and miR-21/miR-122/miR-223, respectively. (Reproduced from Zhou, W.; Tian, Y. F.; Yin, B. C.; Ye, B. C. Anal. Chem. 2017, 89, 6120-6128 (ref 93). Copyright 2017 American Chemical Society.)
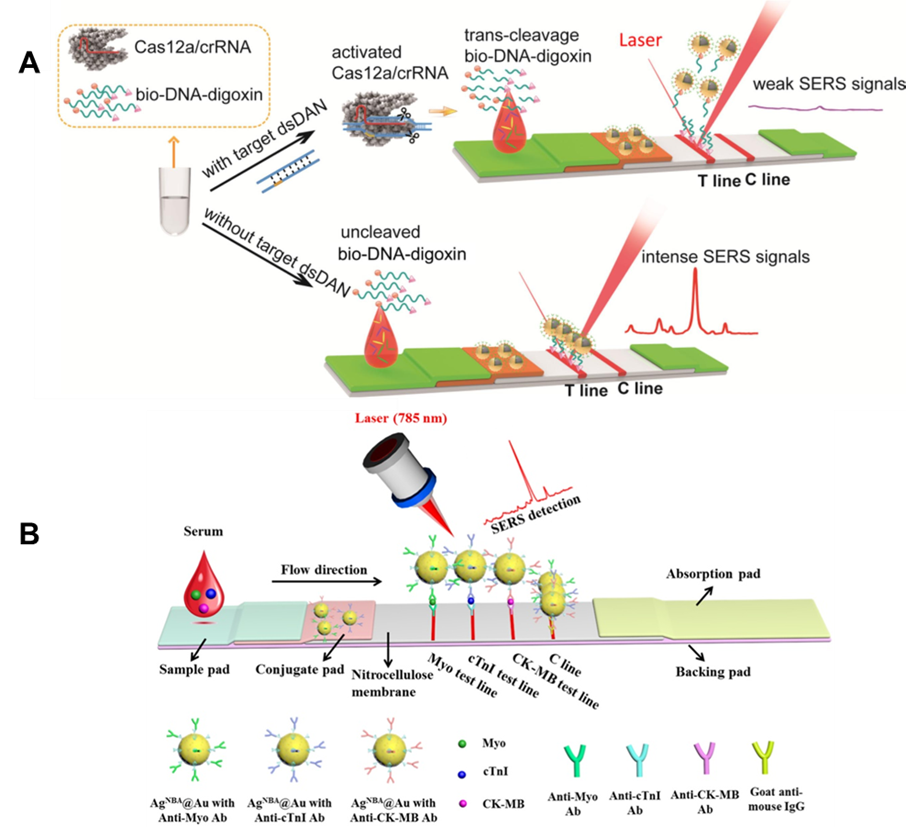
Figure 5. (A) Principle of Cas12a-SERS strip for target dsDNA detection. (Reprinted from Chem. Eng. J., Vol. 429, Pang, Y.; Li, Q.; Wang, C.; Zhen, S.; Sun, Z.; Xiao, R. CRISPR-cas12a mediated SERS lateral flow assay for amplification-free detection of double-stranded DNA and single-base mutation, pp. 132109 (ref 89). Copyright 2021, with permission from Elsevier.) (B) Schematic illustration of the core-shell SERS nanotag-based multiplex LFA. Averaged Raman spectra of three test lines for detection of Myo, cTnI, and CK-MB can be obtained. (Reprinted from Biosens. Bioelectron., Vol. 106, Zhang, D.; Huang, L.; Liu, B.; Ni, H.; Sun, L.; Su, E.; Chen, H.; Gu, Z.; Zhao, X., Quantitative and ultrasensitive detection of multiplex cardiac biomarkers in lateral flow assay with core-shell SERS nanotags, pp. 204-211 (ref 96). Copyright 2018, with permission from Elsevier.)

Figure 6. A. Schematic illustration of SERS nanoprobes with the embedded internal standard for quantitative detection of cholesterol via the Raman spectral fitting method. (Reproduced from Surface-Enhanced Raman Nanoprobes with Embedded Standards for Quantitative Cholesterol Detection, Jiang, X.; Tan, Z.; Lin, L.; He, J.; He, C.; Thackray, B. D.; Zhang, Y.; Ye, J. Small Methods, Vol. 2, Issue 11 (ref 102). Copyright 2018 Wiley.) B. (a)-(b) Normalized SERS spectra of AuNS-4MBA-PA in complete cell culture media with different pH values before (a) and after (b) storage for 9 days. (c) Normalized pH response curves using pH probes with and without polyarginine (AuNS-4MBA-PA and AuNS-4MBA). (Reproduced from Zhang, Y.; Jimenez de Aberasturi, D.; Henriksen-Lacey, M.; Langer, J.; Liz-Marzán, L. M. ACS Sens. 2020, 5, 3194-3206 (ref 110). Copyright 2020 American Chemical Society.)
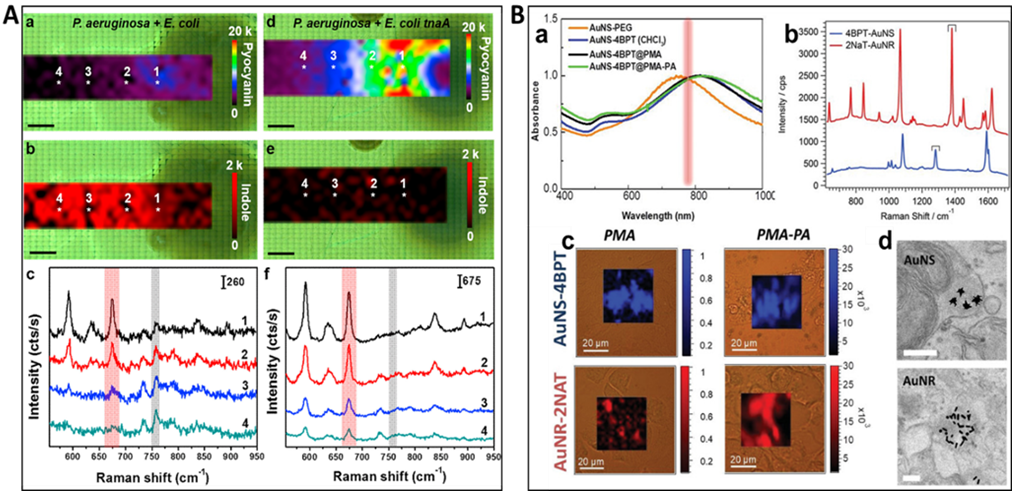
Figure 7. A (a and b) SERS mapping of pyocyanin at 675 cm-1 (a) and indole at 760 cm-1 (b) produced by a colony of P. aeruginosa and E. coli. (c) Representative SERS spectra recorded at the points indicated with white asterisks in (a) and (b). (d and e) SERS mappings of pyocyanin at 675 cm-1 (d) and indole at 760 cm-1 (e) produced by a colony of P. aeruginosa and E. coli tnaA. (f) Representative SERS spectra recorded at the points indicated with white asterisks in (d) and (e). The red and gray shaded bars indicate pyocyanin (675 cm-1) and indole (760 cm-1) specific peaks. The spectra were acquired with a 785 nm laser line, 20× objective and a laser power of 4 mW. Scale bars are 1 mm (For interpretation of the references to color in this figure legend, the reader is referred to the web version of the article.). (Reprinted from Appl. Mater. Today., Vol. 14, De Marchi, S.; Bodelón, G.; Vázquez-Iglesias, L.; Liz-Marzán, L. M.; Pérez-Juste, J.; Pastoriza-Santos, I. Surface-enhanced Raman scattering (SERS) imaging of bioactive metabolites in mixed bacterial populations, pp. 207-215 (ref 119). Copyright 2019, with permission from Elsevier.) B. (a) Prior to encoding, after coating with the respective Raman-active molecules (AuNR-2NAT) and (AuNS-4BPT), after PMA encapsulation (AuNP-RaR@PMA) and further coated with PA (AuNP-RaR@PMA-PA). (b) Raman spectra of AuNR-2NAT and AuNS-4BPT encoded NPs. (c) Cell viability and NP uptake in HDF cells. Brightfield optical images overlaid with colored SERS maps of HDF containing AuNS‐BPT (blue) and AuNR‐2NAT (red) NPs, expressing either anionic (left) or cationic (right) surface charges. Scale bars: 20 μm; (d) TEM images of AuNS‐4BPT@PMA‐PA and AuNR-2NAT@PMA‐PA NPs in HDF cells. Scale bars: 200 μm. (Reproduced from Using SERS Tags to Image the Three-Dimensional Structure of Complex Cell Models, Jimenez de Aberasturi, D.; Henriksen-Lacey, M.; Litti, L.; Langer, J.; Liz-Marzán, L. M. Adv. Funct. Mater. Vol. 30, Issue 14 (ref 120). Copyright 2020 Wiley.)
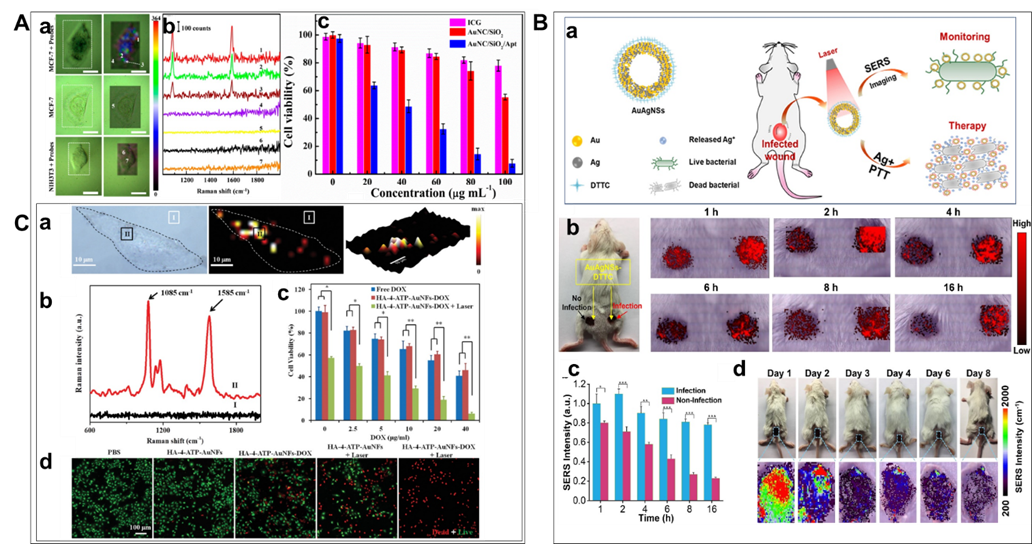
Figure 8. Therapy based on NIR responsible SERS probes: A. (a) SERS images of single MCF-7 cell (or NIH3T3) with and without AuNCs/SiO2/Apt nanoprobes (left: bright field; right: SERS mapping images based on the intensity of 1588 cm-1). (b) Representative Raman spectra at different spots indicated in Figure 8 (a). Dotted rectangles represent SERS imaging areas. Scale bars: 20 μm. (c) Viability of MCF-7 cells cultured with ICG, AuNCs/SiO2 NPs, and AuNCs/SiO2/Apt nanoprobes at different concentrations with laser irradiation (1.5 W/cm2) for 5 min, respectively. Note that the concentrations of AuNCs/SiO2 NPs and AuNCs/SiO2/Apt nanoprobes have been normalized in all photothermal experiments. Five sample replicates were conducted in all experiments. In addition, 20, 40, 60, 80, 100, and 120 g mL-1 of the AuNCs/SiO2/Apt suspension corresponded to the CP of 9.78×10⁹, 1.96× 10¹⁰, 2.93× 10¹⁰, 3.91× 10¹⁰, 4.89× 10¹⁰, and 5.87×10¹⁰ particles per mL, respectively. (Reproduced from Wen, S.; Miao, X.; Fan, G. C.; Xu, T.; Jiang, L. P.; Wu, P.; Cai, C.; Zhu, J. J. ACS Sens. 2019, 4, 301-308 (ref 131). Copyright 2019 American Chemical Society.) B. Illustration of therapy scheme for a multi-functional gold-silver nanoshells (AuAgNSs) nanosystem. When irradiated with a near-infrared laser, not only eliminates Gram-negative Escherichia coli and Gram-positive S. aureus bacterial strains but also inhibit the colony expansion of bacteria through the synergistic effect of photothermal therapy and release of silver ions. (b) Photographic image of a Balb/c mouse with non-infected and infected wounds after applying AuAgNSs-DTTC, and SERS images of non-infected (left spot) and infected (right spots) wounds at different time points after AuAgNSs-DTTC application. (c) Quantification of SERS intensity of non-infected and infected wounds after applying AuAgNSs-DTTC. Data are presented as mean standard error of mean (SEM). Three replicates were performed for each experiment. (d) Photographic images and corresponding pseudo-color-coded SERS images of AuAgNSs-DTTC-applied wounds at up to 8 days after treatment. All measurements were performed with an excitation laser wavelength of 785-nm, 3 mW for 0.1 s at the concentration of 18.7 μg mL-1 (*: p < 0.05, **: p < 0.01, ***: p < 0.001). (Reprinted from Biomaterials, Vol. 234, He, J.; Qiao, Y.; Zhang, H.; Zhao, J.; Li, W.; Xie, T.; Zhong, D.; Wei, Q.; Hua, S.; Yu, Y.; Yao, K.; Santos, H. A.; Zhou, M. Gold-silver nanoshells promote wound healing from drug-resistant bacteria infection and enable monitoring via surface-enhanced Raman scattering imaging, pp. 119763 (ref 134). Copyright 2020, with permission from Elsevier.) C. (a) Raman imaging of MDA-MB-231 cells incubated with HA-4-ATP-AuNFs. (b) Raman spectra of HA-4-ATP-AuNFs at points I and II. (c) Cell viabilities of MDA-MB-231 cells with different treatments. *p < 0.05, **p < 0.01. (d) Fluorescent microscopy images of live/dead MDA-MB-231 cells treated with different conditions with or without NIR laser irradiation (1064 nm, 1 W/cm). Live cells were stained green with calcein-AM and dead cells were stained red with PI. (Reproduced from Gold Nanoframeworks with Mesopores for Raman–Photoacoustic Imaging and Photo-Chemo Tumor Therapy in the Second Near-Infrared Biowindow, Wang, J.; Sun, J.; Wang, Y.; Chou, T.; Zhang, Q.; Zhang, B.; Ren, L.; Wang, H. Adv. Funct. Mater., Vol. 30, Issue 9 (ref 142). Copyright 2020 Wiley.)
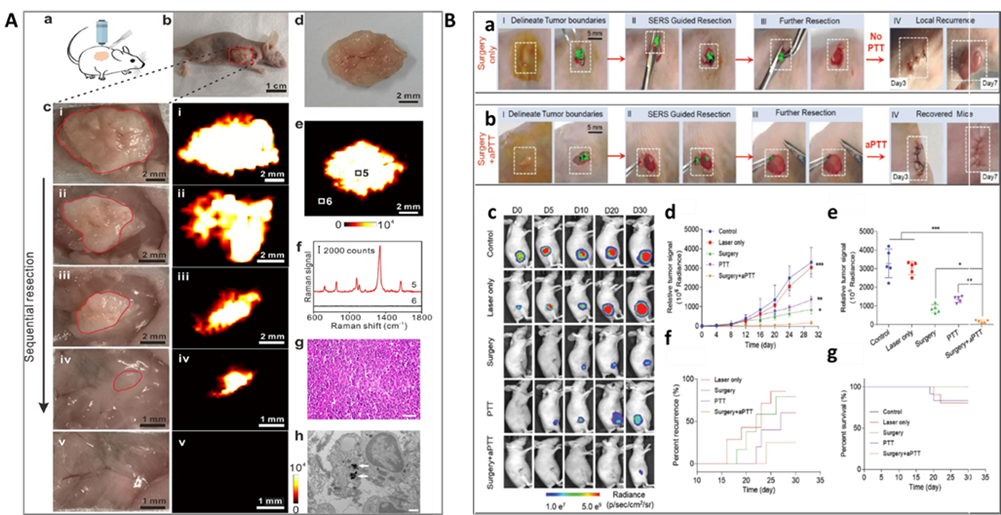
Figure 9. SERS imaging-guided surgery therapy: A. In vivo intraoperative Raman imaging-guided tumor excision and ex vivo tumor SERS imaging. (a) Cartoon illustration of Raman imaging-guiding tumor resection at 6 h after intravenous injection of Gd-GERTs. (b) Photography of the animal model before tumor excision. The red box indicates the tumor site. (c) The photographs (left) and the corresponding Raman images (right) during the sequential tumor resection until the entire tumor had been removed. (d) Photograph and (e) the corresponding Raman image of a resected gross tumor at 24 h after injection. (f) Raman spectra acquired from point 5 and 6, indicated in panel e. (g) H&E staining of the resected tumor. The scale bar is 20 μm. (h) TEM image of the tumor tissue. The white arrows indicate the existence of Gd-GERTs. The scale bar is 500 nm. (For interpretation of the references to color in this figure legend, the reader is referred to the web version of this article.) (Reprinted from Acta Biomater., Vol. 104, Shi, B.; Zhang, B.; Zhang, Y.; Gu, Y.; Zheng, C.; Yan, J.; Chen, W.; Yan, F.; Ye, J.; Zhang, H. Multifunctional Gap-Enhanced Raman Tags for Preoperative and Intraoperative Cancer Imaging, pp. 210-220 (ref 146). Copyright 2020, with permission from Elsevier.) B. Raman image-guided resection and adjuvant photothermal therapy (aPTT) of the subcutaneous SKOV3 ovarian tumors. (a) and (b) Raman image-guided surgery and with the adding of adjuvant photothermal treatment. (785 nm, 150 mW, 5×objective, 0.2 s integration time, and 3-10 min in total). (c) Bioluminescent images of the representative mice from 5 different treatment groups. (d) Variation of the tumor BLI signals after different treatments. (e) Relative tumor signals measured in different groups after 30 days. (f) The rate of tumor recurrences in different treatment groups. (g) Kaplan–Meier plot showing the rate of mice survival in different groups. In vivo bioluminescence images were used to track tumor signals in different groups of mice. Data are presented as the mean ± SD, p values were calculated by Student's t-test, (n = 5, **p < 0.01, ***p < 0.001, relative to the control mice). Reprinted with permission from ref 150. Copyright 2021 John Wiley and Sons. (Reproduced from Intraoperative Assessment and Photothermal Ablation of the Tumor Margins Using Gold Nanoparticles. Wei, Q.; Arami, H.; Santos, H. A.; Zhang, H.; Li, Y.; He, J.; Zhong, D.; Ling, D.; Zhou. Adv. Sci., Vol. 8, Issue 5 (ref 150). Copyright 2021 Wiley.)
Summary and perspective
In general, we reviewed the recent progress of SERS in the NIR window, which was achieved through the combination of different function materials (substrates, Raman reporter molecules and functional groups). By taking advantage of the narrow width and plasmonic resonance properties, SERS as a powerful analytical platform for biological and biomedical applications showed high specificity and low LOD. To fully exploit the potential of SERS probes in biomedical applications, nearly decades of exploration and innovation in substrate materials (from noble metal NP to semiconductor and carbon nanotubes) have been researched to develop their biomedical application potential. Besides, the general uses of hybrid SERS substrates provide a novel platform to combine enhanced electromagnetic and chemical properties with various novel materials. Based on the fact the combination of resonance and surface enhancement results in a signal enhancement up to 1014, the work of developing Raman reporter molecules whose absorption maximum resonates with the NIR detection laser has received a great deal of attention and fluorophores are the most potential candidate reporter molecule. Although many different types of mixed substrate materials may not have the significantly high enhancement factor (ca. 106) of pure gold or silver substrates, their high affinity for the analyte molecule can increase the number of surface molecules, as well as the combination of different packaging layers to improve their hydrophobicity, thereby improving detection sensitivity and selectivity
Under the conventional short-wavelength excitation light, SERS detection is limited by a limited tissue penetration depth. As the biological window allows to penetrate several tissues of 100 nm in NIR range, 785 nm laser was applied first in vivo studies. With the acquisition of InGaAs CCD, the research on the second NIR windows has been explored. In addition, the second NIR window shows further improved detection sensitivity, spatial resolution, and tissue penetration ratio than the first NIR window. Meantime, the detection efficiency between 900 nm and 1000 nm is low, so it is necessary to further develop efficient CCD detector. Still, there are far fewer optimized reporter molecules for NIR II and efforts to improve SERS sensitivity have been turned to the development of Raman reporter molecules due to the presence of strong anisotropic resonance particles in NIR II. By functionalizing the surface of nanoparticles, the synthesis of NIR-responsive SERS probes has been widely developed in clinical practice.
We reviewed the exploration and application of NIR-responsive SERS probes in recent years. Although so much significant progress has been made, there is still a long way to go. In the future, the application of SERS in vivo needs to pay more attention to the stability of the composition of SERS nanoparticles in the complex environment of the human body and the importance of monitoring the long-term fate of their particles, including the biological toxicity of the particles and the clearance rate of various organs. We hope that this review can provide insights for biological and biomedical researchers searching for new sensitive biosensing and bioimaging methods.